Thanks for your feedback!
EDIT
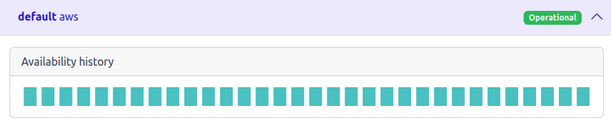
The gateway pool availability history is shown in a graph. You can view metrics for up to 31 days.
The daily statuses are presented in four colors. The colors represent the gateway availability percentage during the day:
Green: gateway operational during the entire day;
Orange: degradation or slowness at some point in the day;
Red: some incident with total or partial unavailability;
Gray: lack of metrics. Common situation in new gateways.
Share your suggestions with us!
Click here and then [+ Submit idea]