
Thanks for your feedback!
EDIT
|
| Version | Base URL | Authentication |
|---|---|---|
v.5 (Sensedia Platform) |
|
|
v.4 |
Your custom Base URL |
|
Regarding Analytics when coupled to the platform, the current version offers greater flexibility, allowing you to customize queries with much more granularity.
For that, we now have the {/analytics/v1/products/api-gateway/traces/query} endpoint, which replaces api-metrics.
See below an example:
Getting the total calls for the day with the endpoint traces/query
This information is also available in video. See (video 1) at the end of this page.
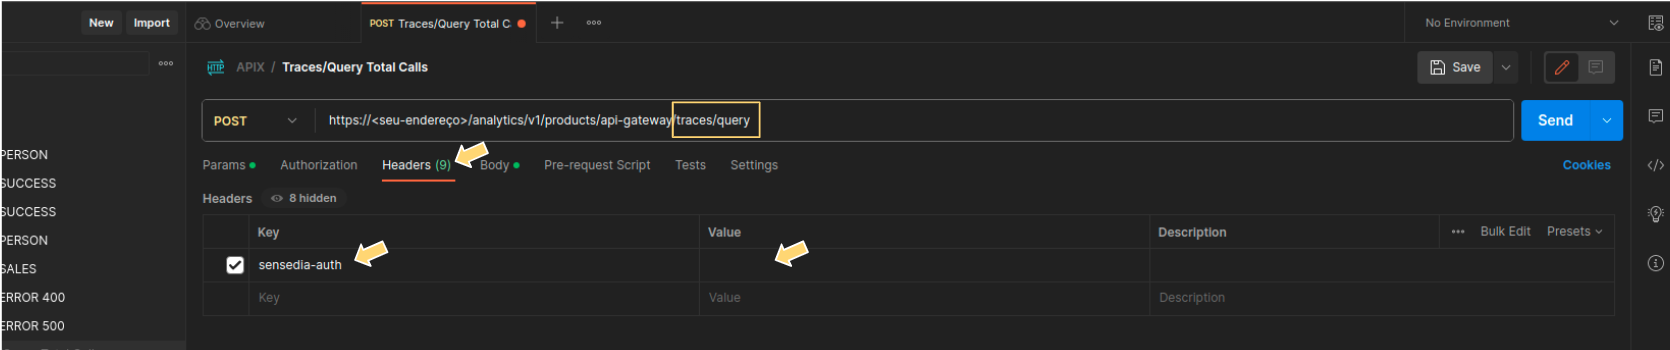
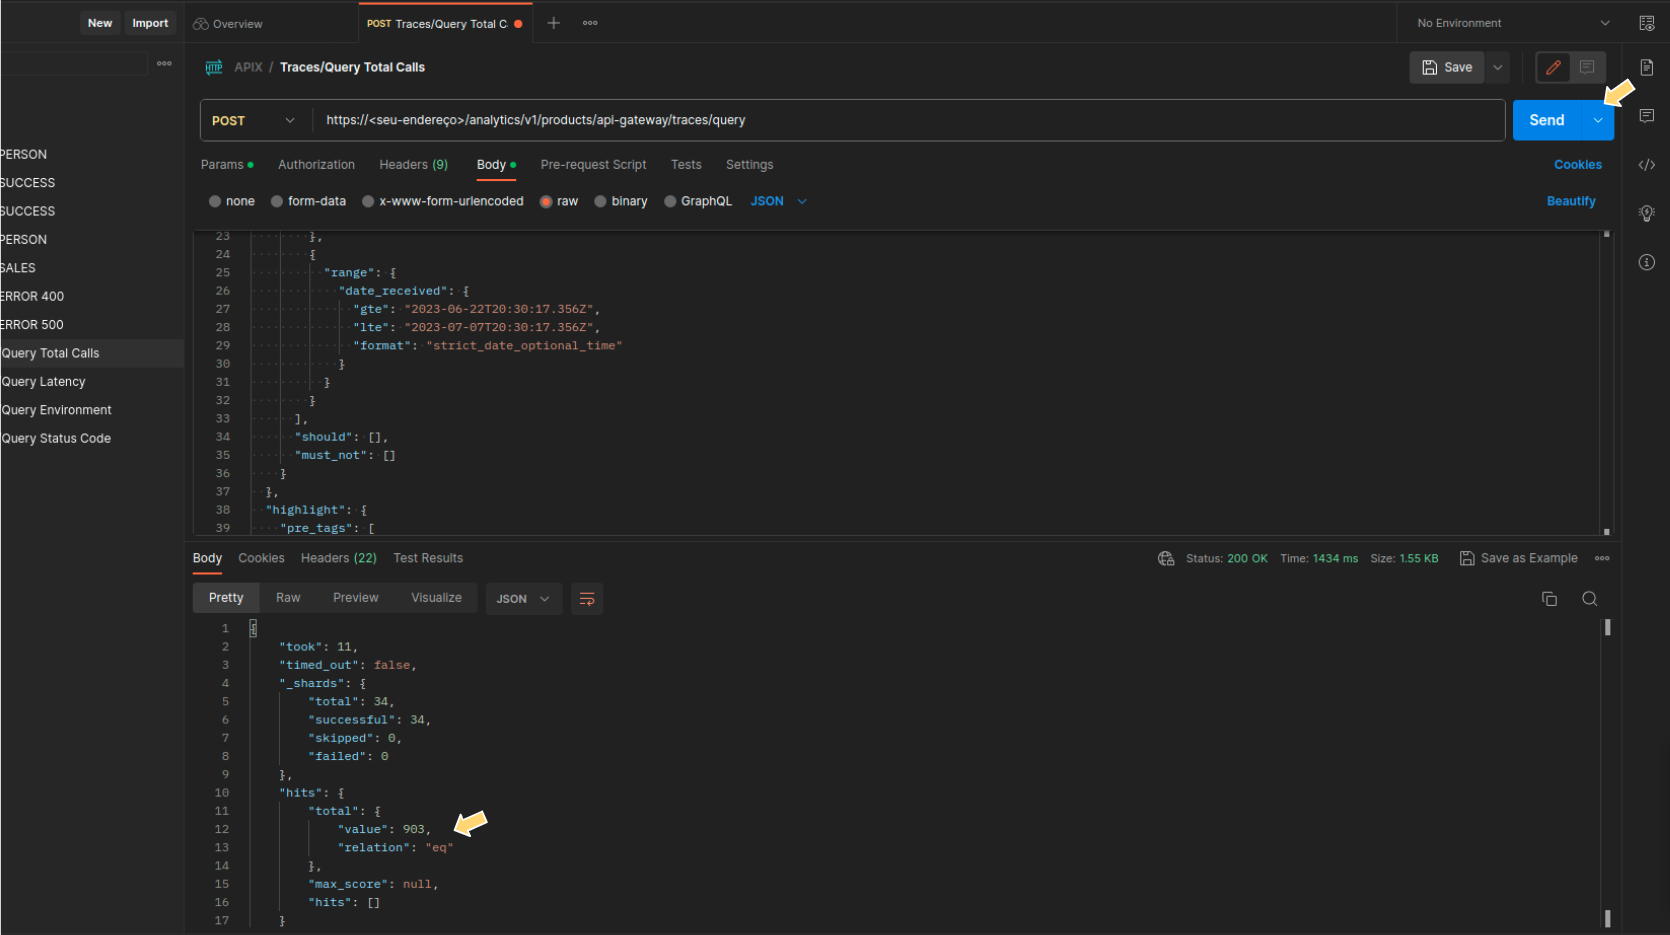
In the tool of your choice (e.g., Postman), select the POST method and enter your URL with the endpoint {/analytics/v1/products/api-gateway/traces/query}.
In Headers, configure authentication according to your version:
v.4: enter the sensedia-auth key. See here how to obtain this value.
v.5: enter the Authorization key and, in the value, insert your access-token.
In v.5, you can obtain the access-token through the cookie of the same name in your browser after logging into Sensedia Platform.
|
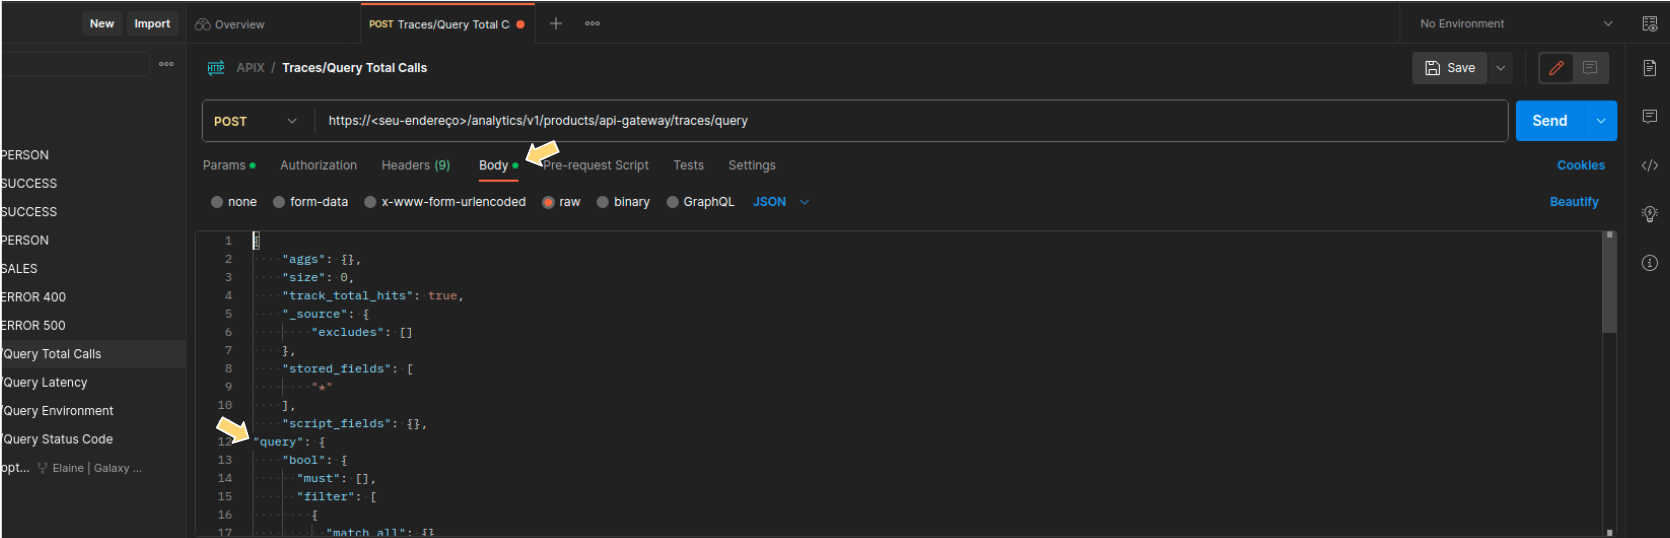
Write your query in the body of the request.
You can use DQL or Lucene.
There are easy ways to get the query, either from a General Trace filter or from a Dashboard visualization.
Click SEND and see the result in the body of the response.
Here are some tips to save you time.
You can build the query using Analytics' graphical interface and then copy and paste it in step 3 above.
See below how to do that.
| Queries made accessing the /traces/query endpoint have some limitations such as timeout and rate limit. Therefore, it is indicated only for specific searches. For more comprehensive data extraction, use Data Streaming. |
Follow the example steps below to generate a query from the General Trace GUI.
The steps can be used with any combination of filters, defined in step 1 below.
Example of a shortcut to write a query using Generarl Trace
This information is also available in video. See (video 2) at the end of this page.
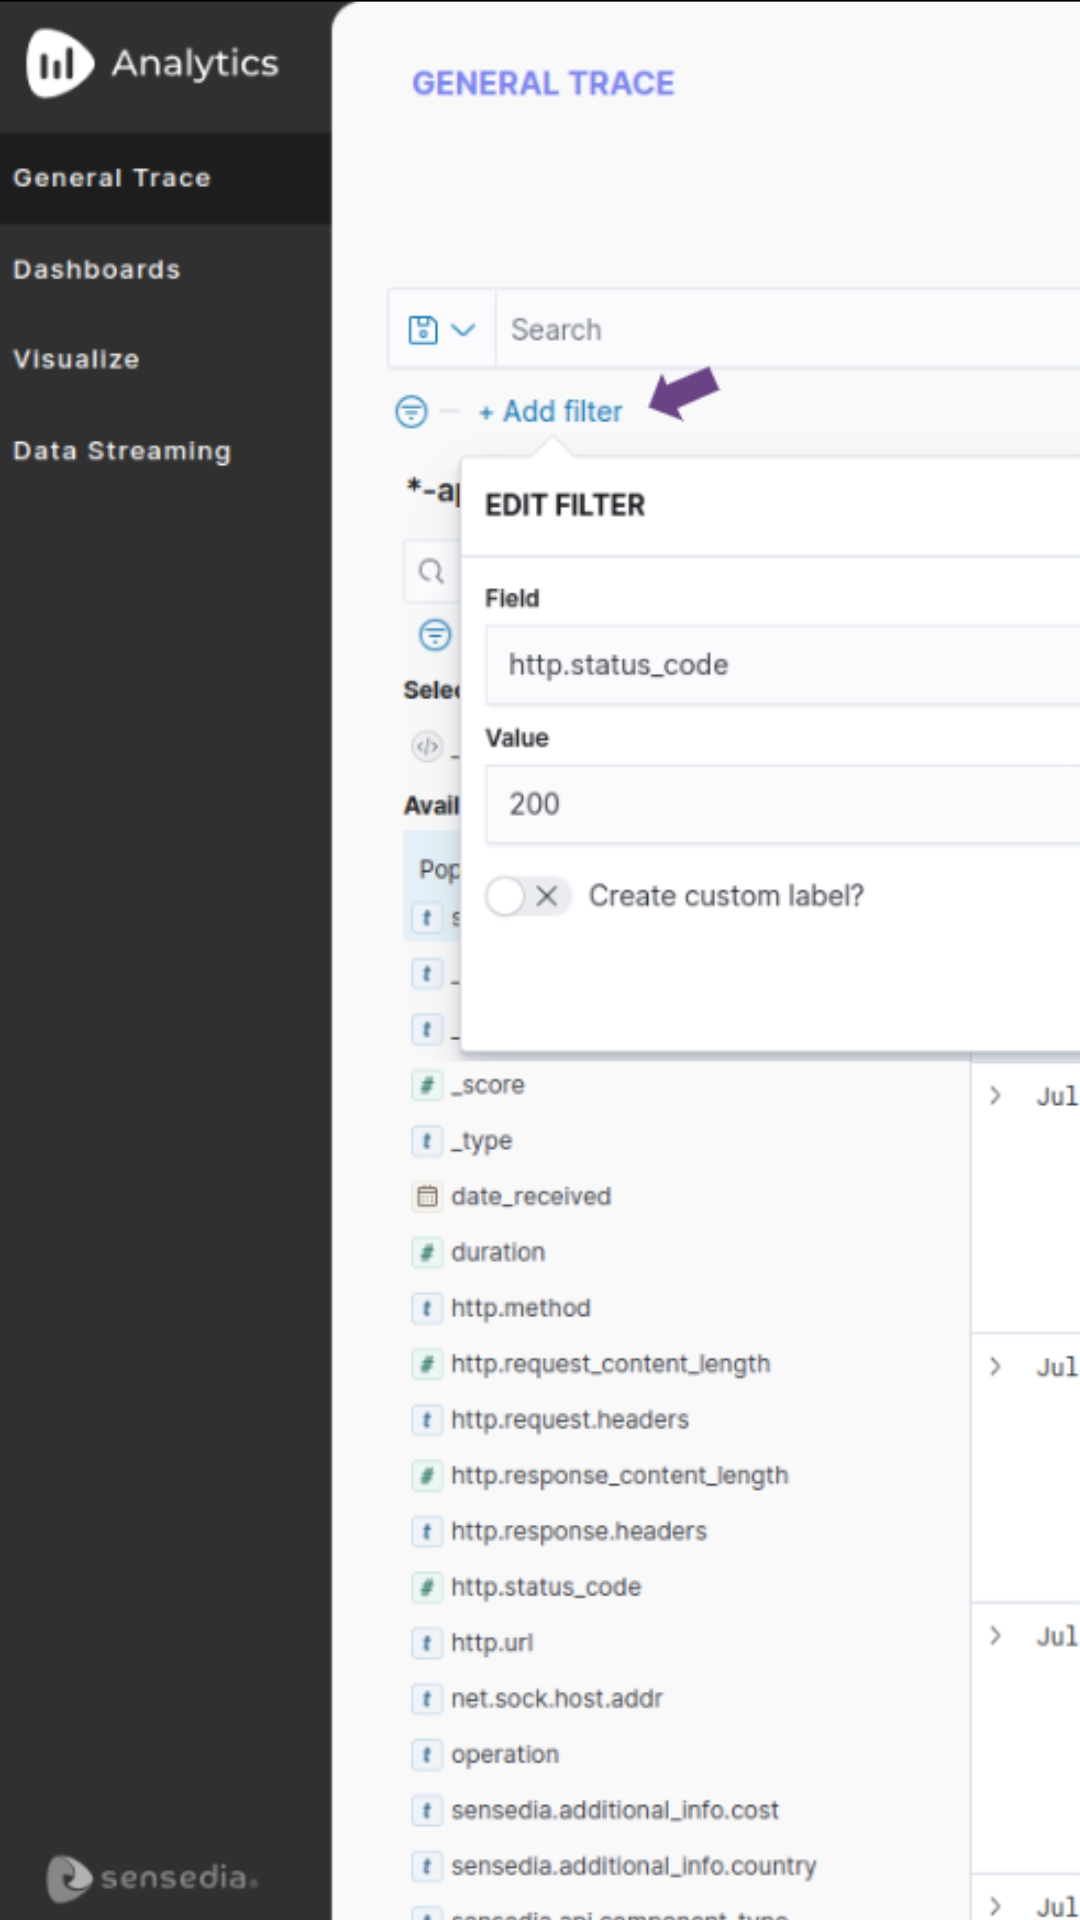
In Analytics, under General Trace, create a search using the available filters and fields.
For this example, let’s define a filter using the field for status code and a time range of 1 week, as shown in the image below.
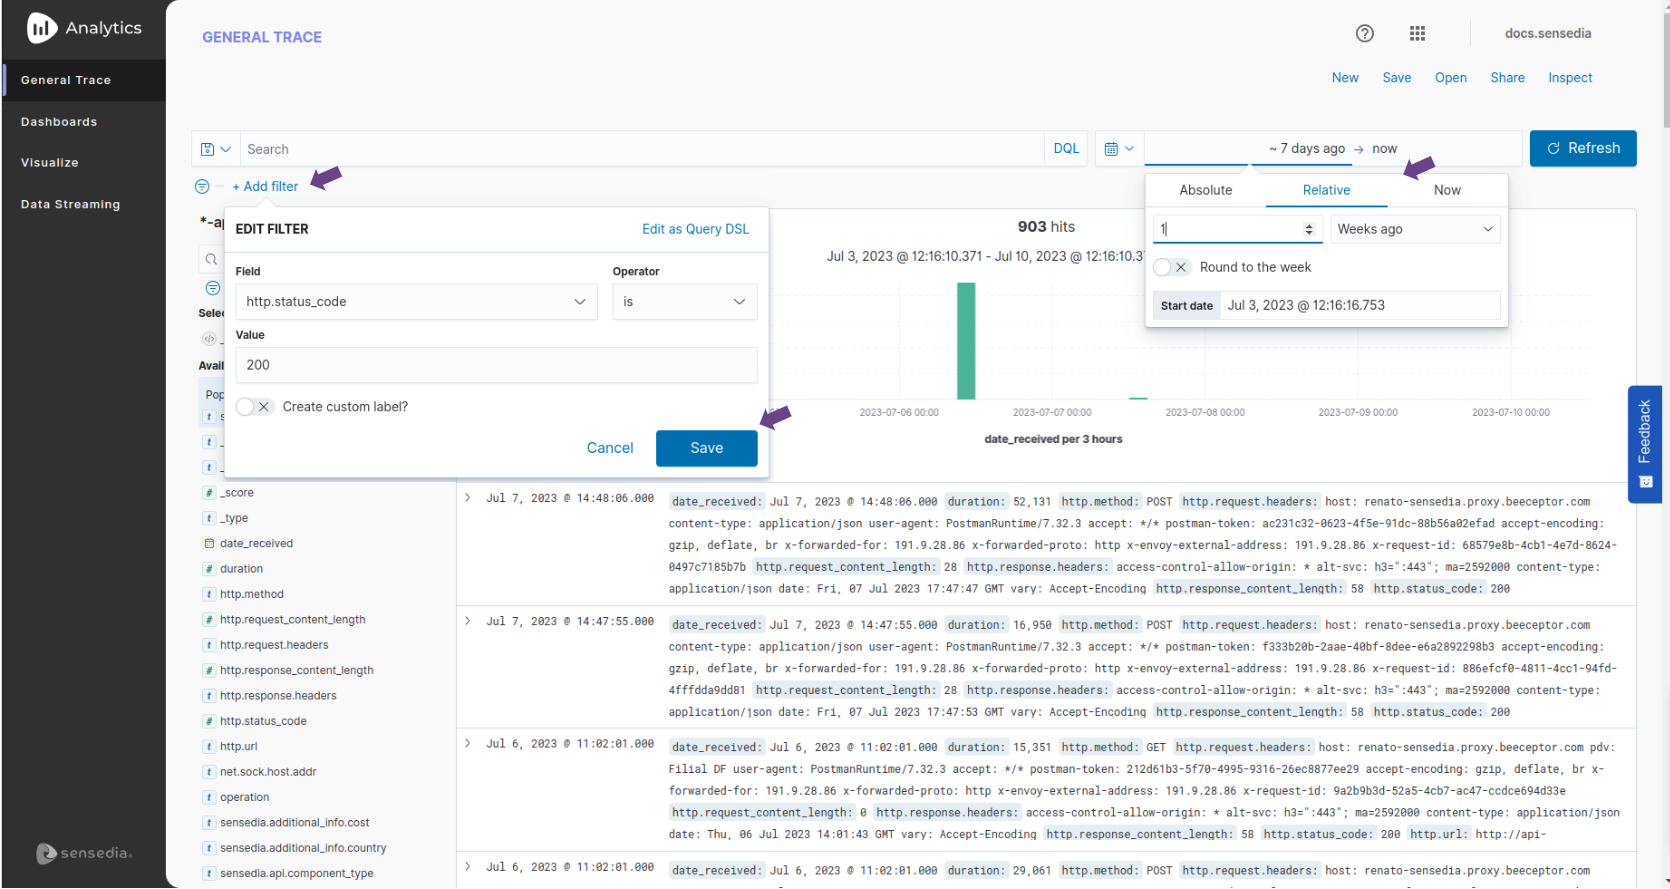
Once the filters are created, click Inspect.
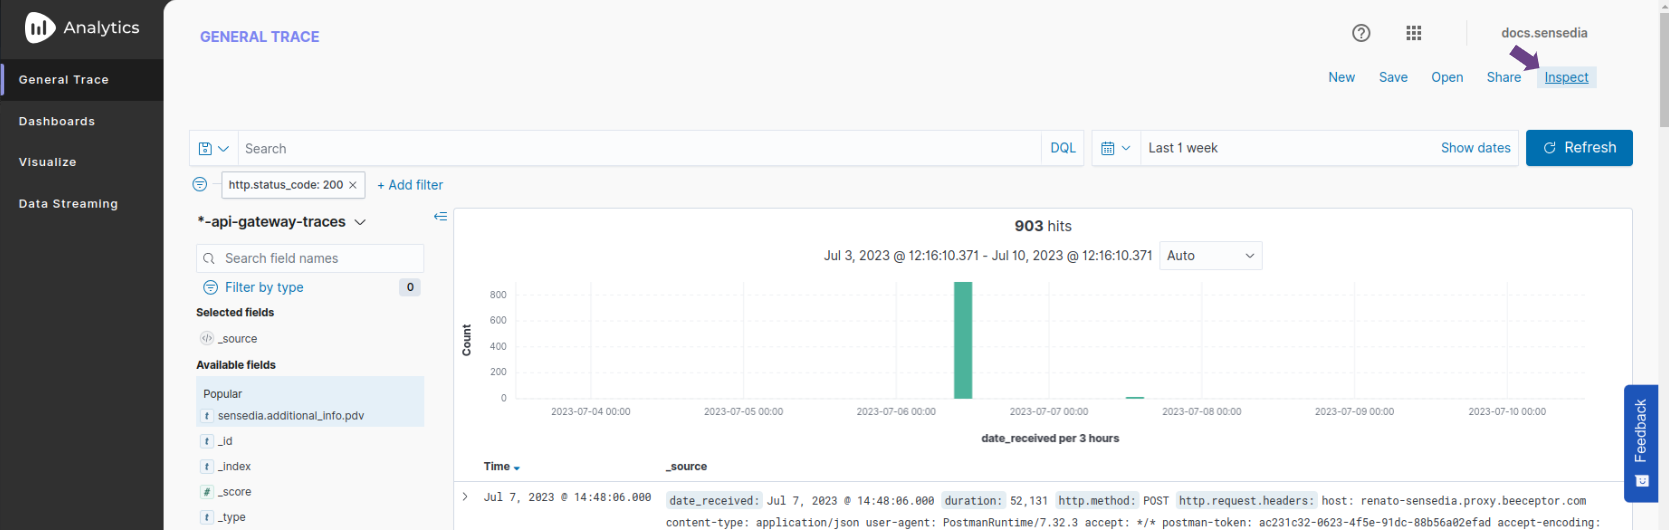
Click Request and look for the query.
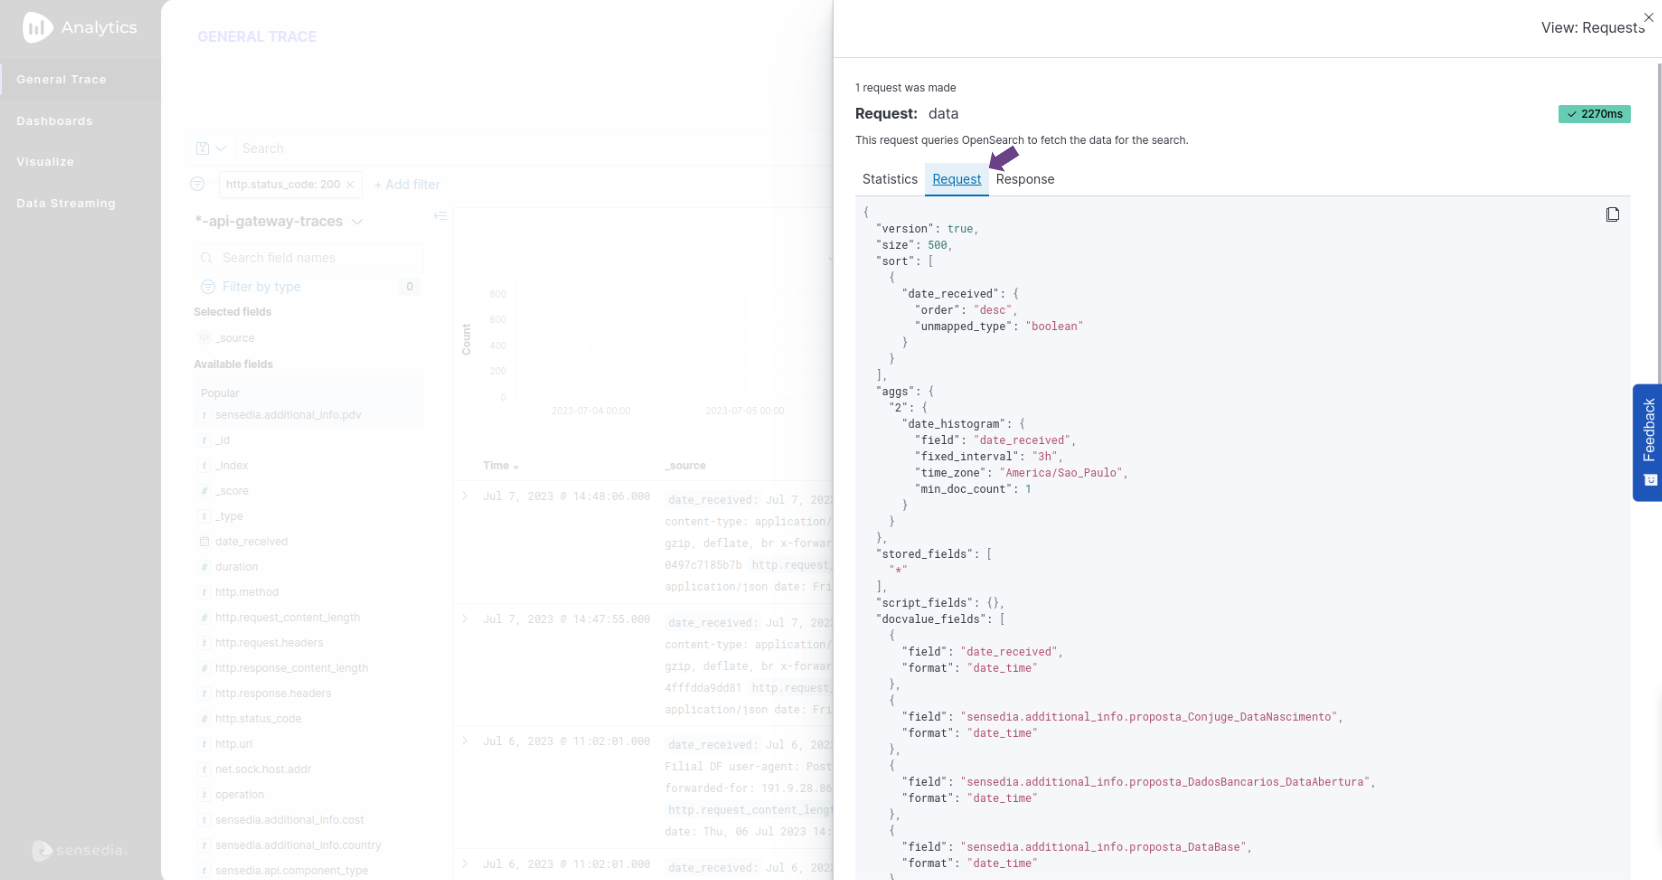
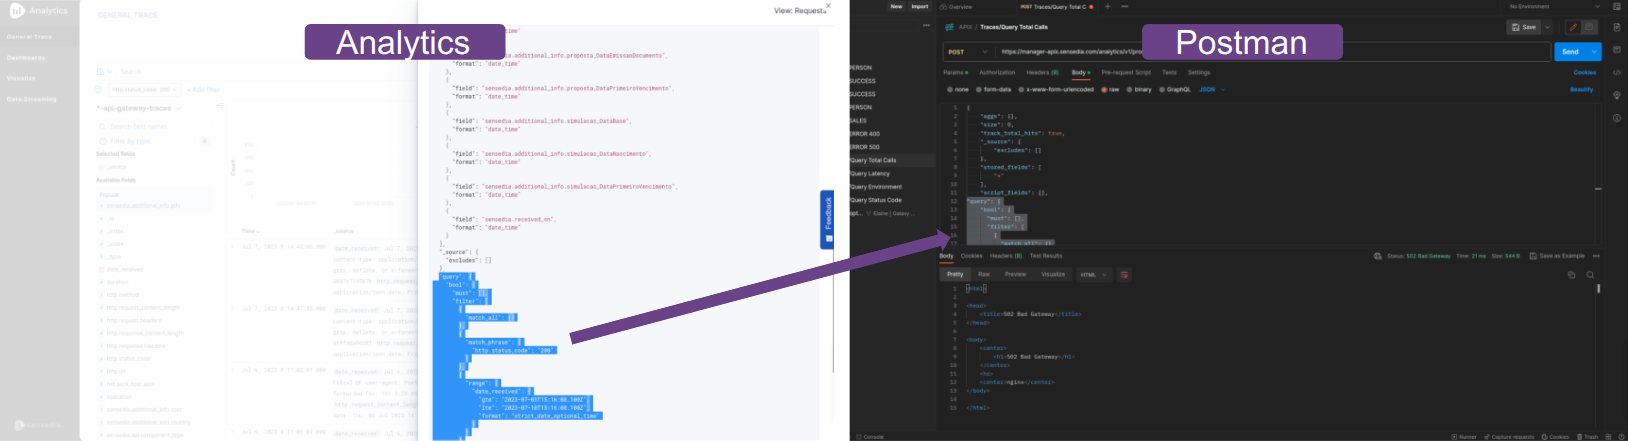
Select and copy the query from Inspect > Request from General Trace.
This query is used in step 3 of the first example, that is:
Go to Postman and paste the query in the appropriate place in the request’s Body.
Pay attention to the beginning and end of the braces.
Still in Postman, click SEND and check the result in the body of the response.
Follow the steps from the example below to generate a query from the Dashboard or Visualize graphical interface.
These steps can be used with any visualization.
You can tailor the search to bring up what you need using the features of Visualize or Dashboards.
Example of shortcut to write a query with aggregation using Dashboards
This information is also available in video. See (video 3) at the end of this page.
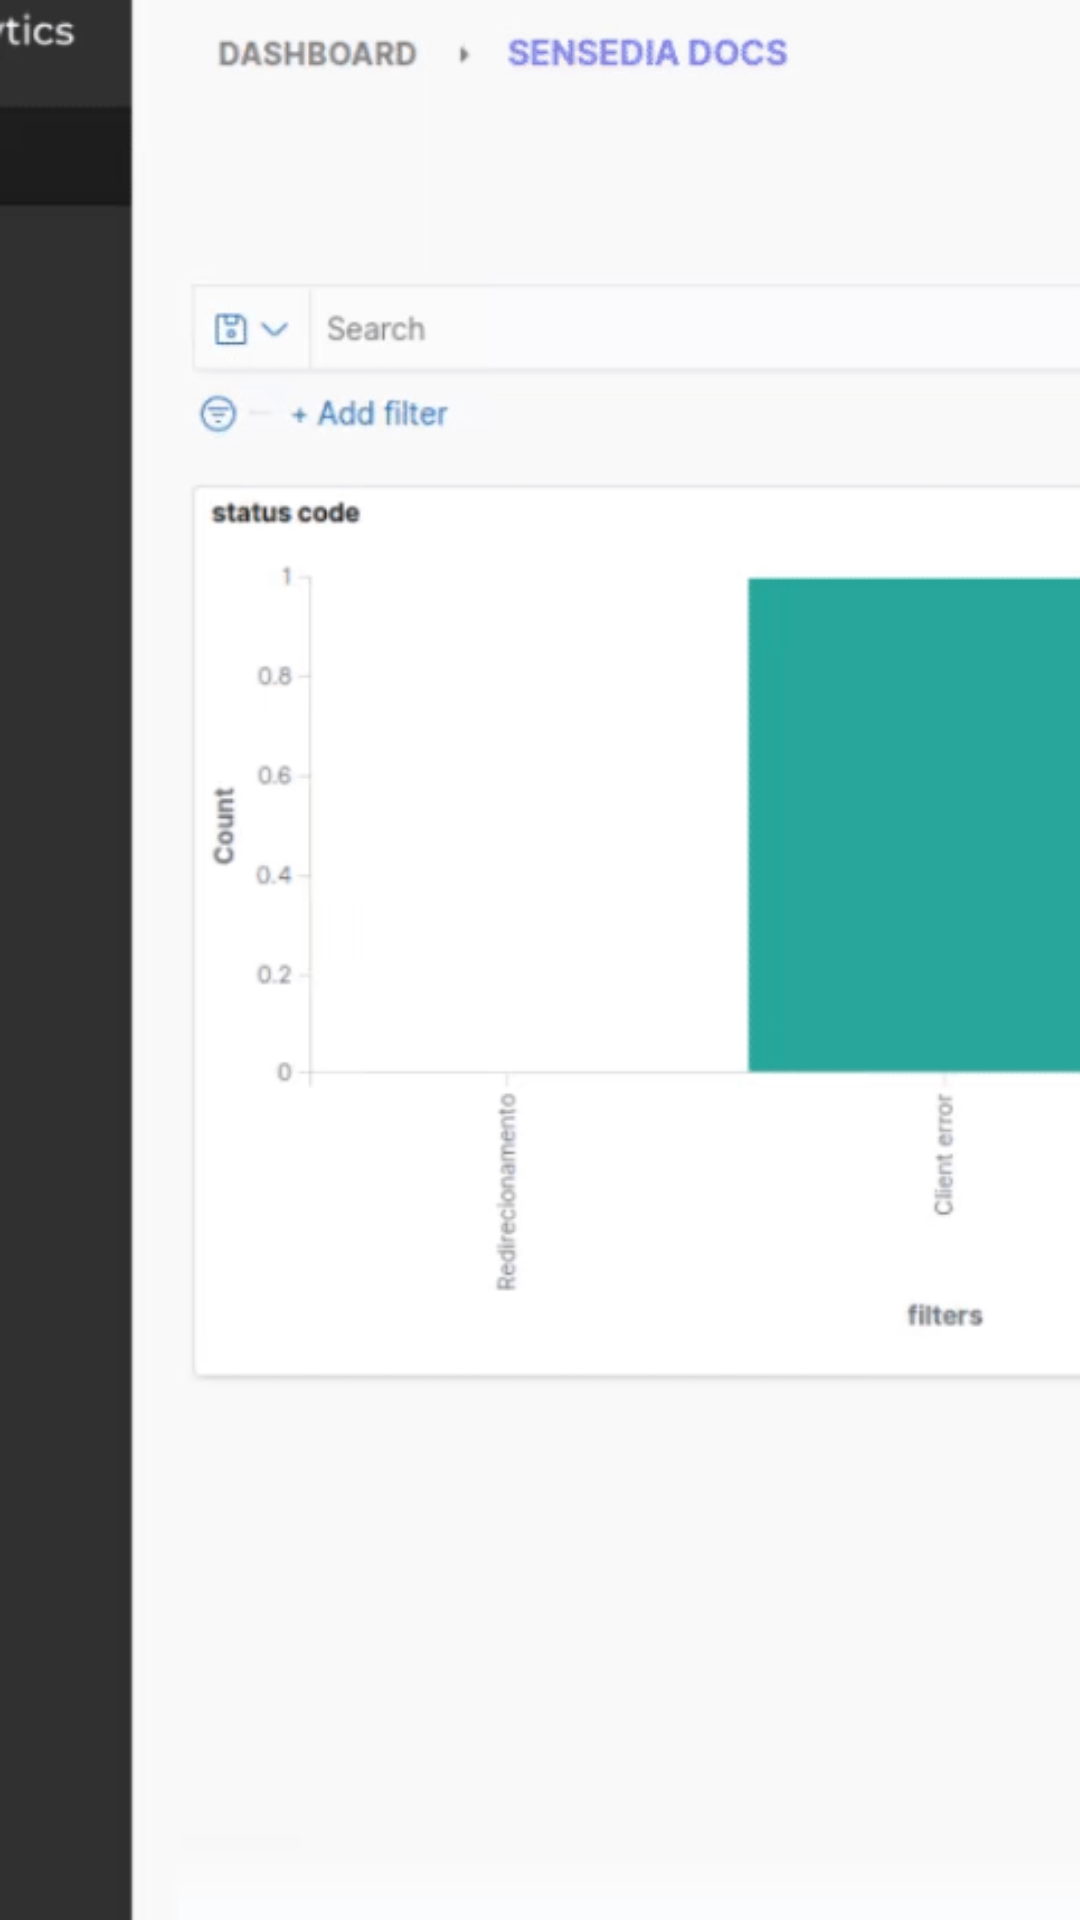
In Analytics, enter Dashboards.
In the list with your Dashboards, find and open the Dashboard that contains the visualization with the aggregation you want.
Click the icon in the upper-right corner of the panel containing the chosen visualization and click More > Inspect.
Then click View:Data > Requests > Request and copy the entire query.

Go to Postman and paste the query into the Body of the request.
Still in Postman, click SEND and check the result in the body of the response.

Here you have the same steps mentioned above, now in quick walkthrough videos.
1. Endpoint traces/query |
2. Query from General Trace |
3. Query from Dashboards |
||
|
|
|
Share your suggestions with us!
Click here and then [+ Submit idea]