Thanks for your feedback!
EDIT
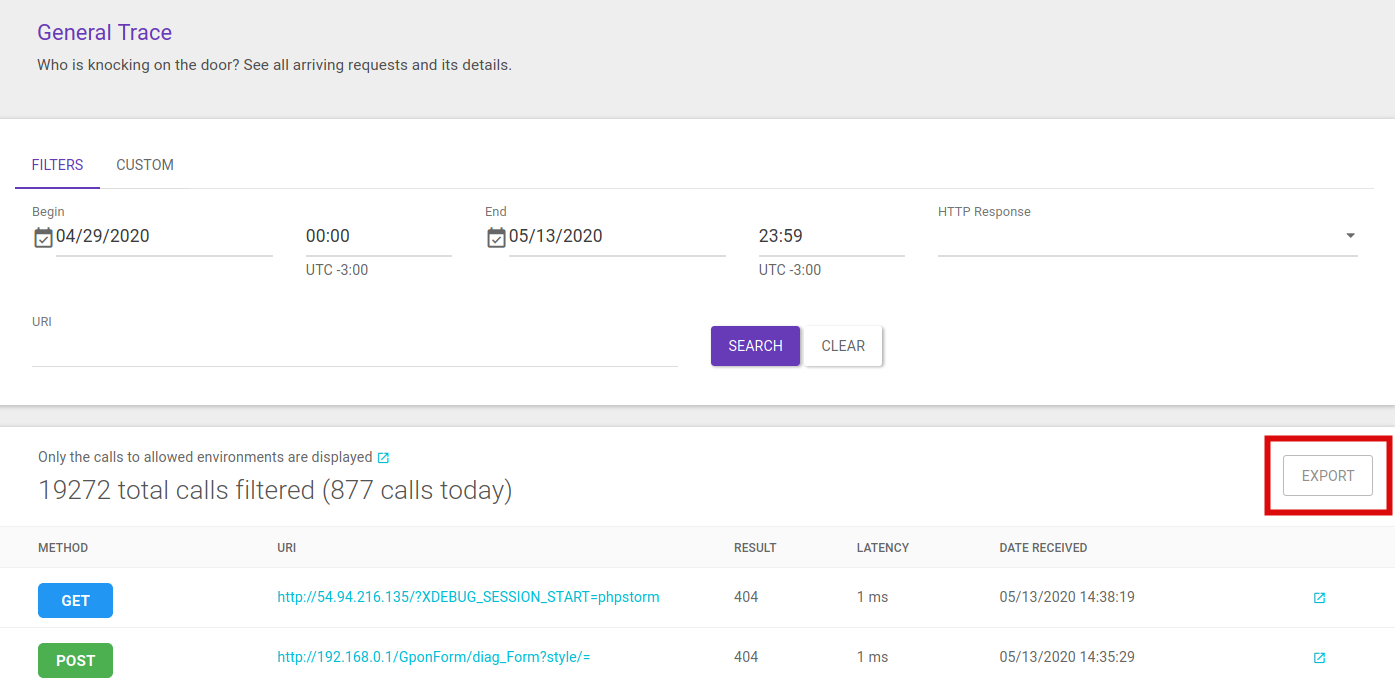
General Trace is an important tool for checking and monitoring calls made by apps to your APIs and managed by the Manager. It is found in the main menu.
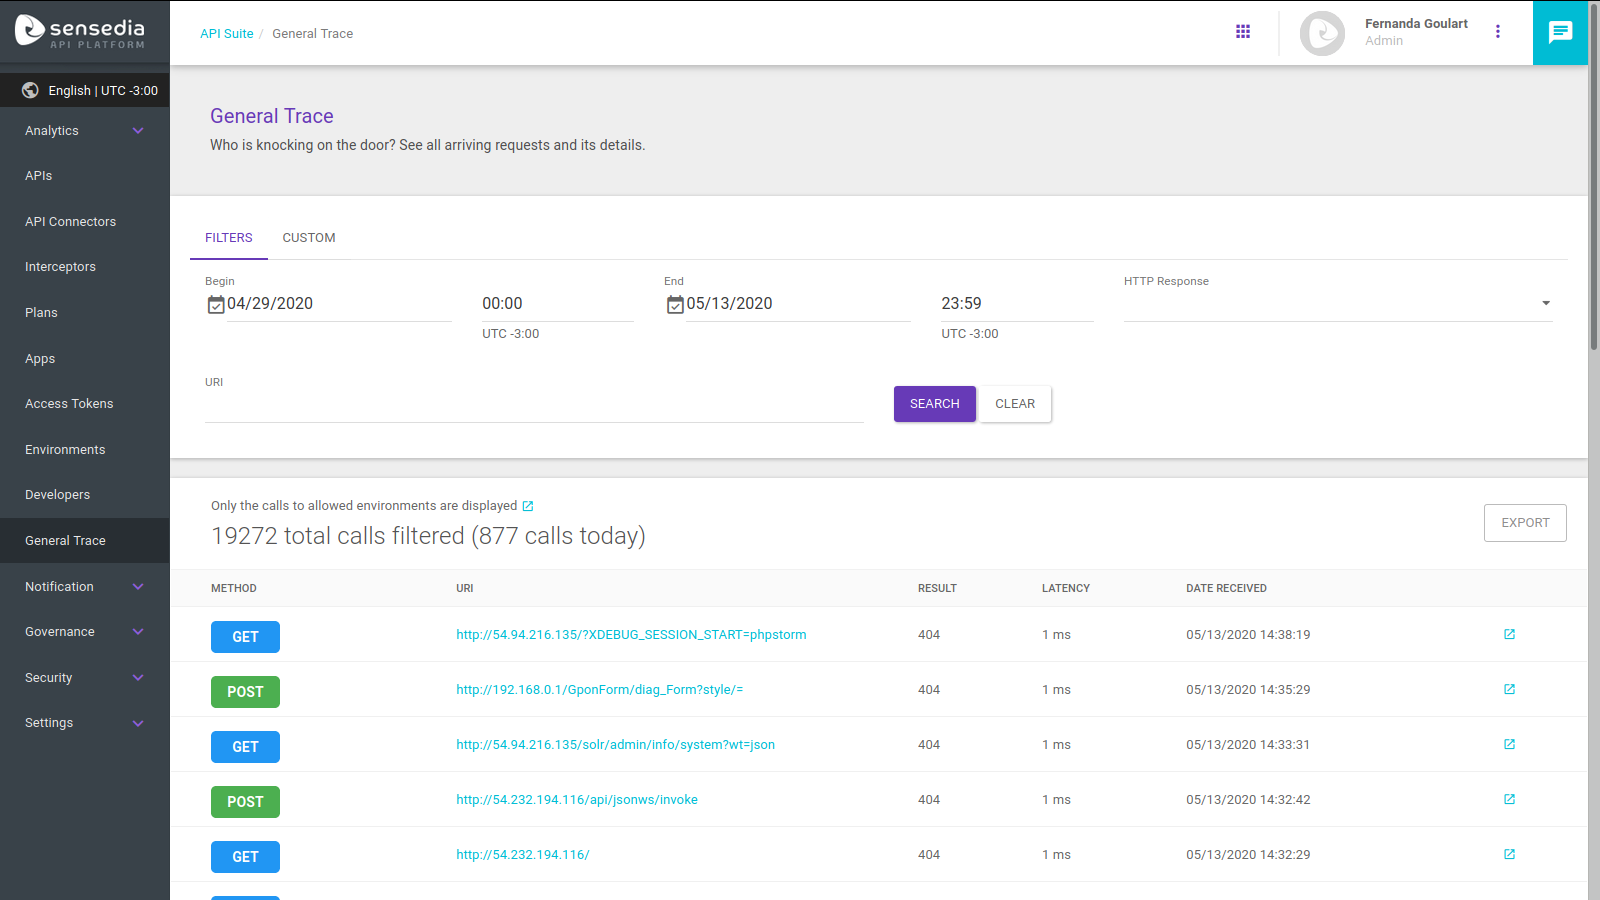
The page displays a list of all the calls that have been made to your APIs and allows visualising their details. It is also possible to filter them and even export them to a JSON file.
| The API Trace page, accessed through an API card on the APIs screen, works as a General Trace filter, showing the calls to that one specific API. With the exception of the custom search field, it has the same features you see in this section. |
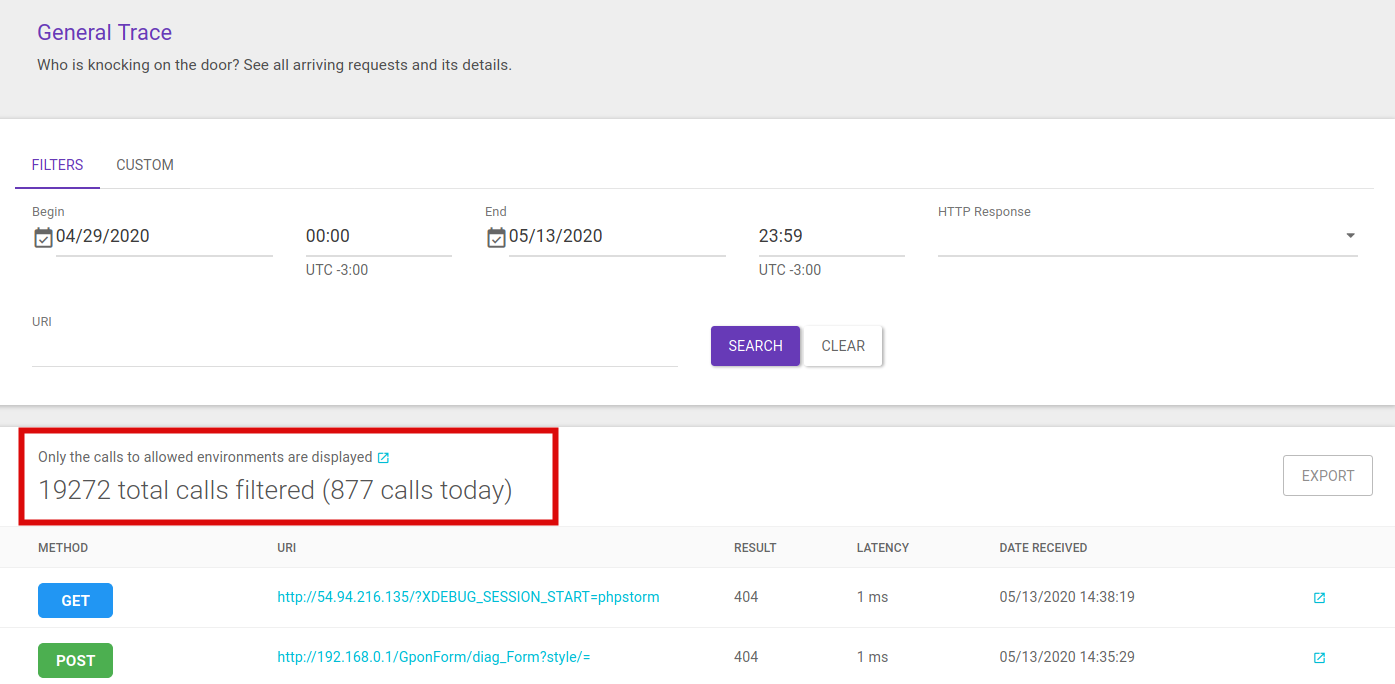
The content of the calls list is filtered following the permission configuration of the Environment Trace Visibility field of each environment.
This configuration sets that only the environment that the user has access to will have its calls displayed on the General Trace list.
You can view the environments you have access to by clicking the ![]() button above the total calls number, next to the message "Only the calls to allowed environments are displayed".
button above the total calls number, next to the message "Only the calls to allowed environments are displayed".
| The Environment Trace Visibility option is configured on the environment creation or edition screens (read more about it here). |
The calls list screen is paged and you can choose the number of records shown per page (10, 25, 50 or 100) to facilitate navigation.
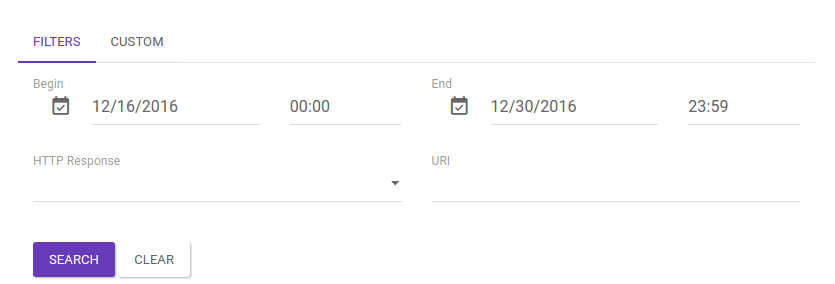
The calls list has two types of filters to simplify searching for records:
URI: listed calls will be filtered according to the field "URI" registered in an API. This is the same address used to make requests to an API.
Time: this filter consists of two fields (begin and end) to return information according to the period desired. The filter can be configured indicating a limit of days and hours to be searched.
HTTP Response: it is a filter that makes it possible to search for calls to APIs that have returned success (from HTTP 200 to 399), client error (from HTTP 400 to 499, with exception of 413 and 429), block (HTTP 413 or 429), or server error (HTTP 500 up to 599).
To apply the filters and list only selected calls, click the Search button. You can click the Clear button to erase the selected filters. In this case, the full list of calls will be retrieved again.
| When multiple filters are selected, they work together; the Time filter returns records of a 14-day range. |
In the Custom tab, next to Filters, you can carry out call custom searches by inserting special parameters. With this, you can filter the General Trace list more thoroughly.
The custom search uses Lucene syntax and indexes. Access the Elasticsearch Data Dictionary to consult the accepted parameters.
To filter the data, insert a valid query into the Custom Search field and click the Search button.
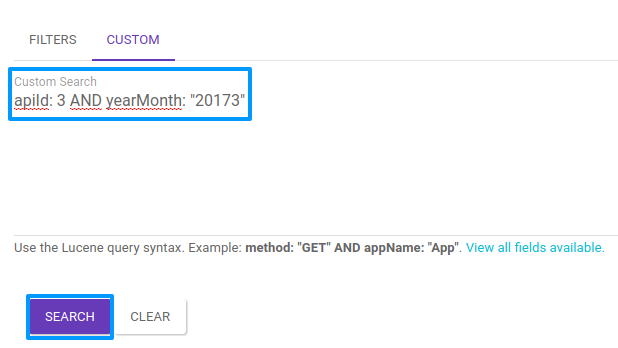
In the example of the image above, we are searching for calls that contain an API ID of value 3, and calls occurred in March 2017.
To erase the field and insert another query, click the Clear button.
| The Filters and Custom tabs work independently, so you cannot use the filters alongside a custom query to search for calls. |
The items on the General Trace list can be inspected for details of a specific call.
To do so, click on the URI of the call or the ![]() button on the right side of the call row.
In the second case, the information will be displayed on a different browser tab.
button on the right side of the call row.
In the second case, the information will be displayed on a different browser tab.

The detail screen contains two tabs: Overview and Gateway Trace.
The Overview tab displays general information about the call in much more detail.
The Gateway Trace displays the Gateway log of the time the call was made.
This section can be used as an audit, analysis or maintenance tool.
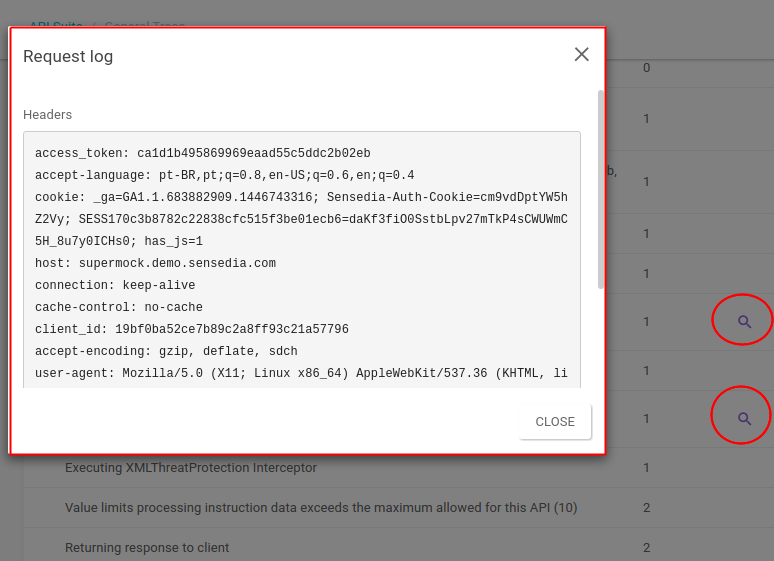
Some log items contain a ![]() icon in the Details column.
This means that there are additional details that can be viewed.
Upon clicking the icon, a modal window will exhibit these details, as in the example below.
icon in the Details column.
This means that there are additional details that can be viewed.
Upon clicking the icon, a modal window will exhibit these details, as in the example below.
The Export button, found right above the calls list, exports all calls from the list being displayed to a JSON file. If a filter is used, only the calls returned by the search will be exported.
Share your suggestions with us!
Click here and then [+ Submit idea]