Dashboard
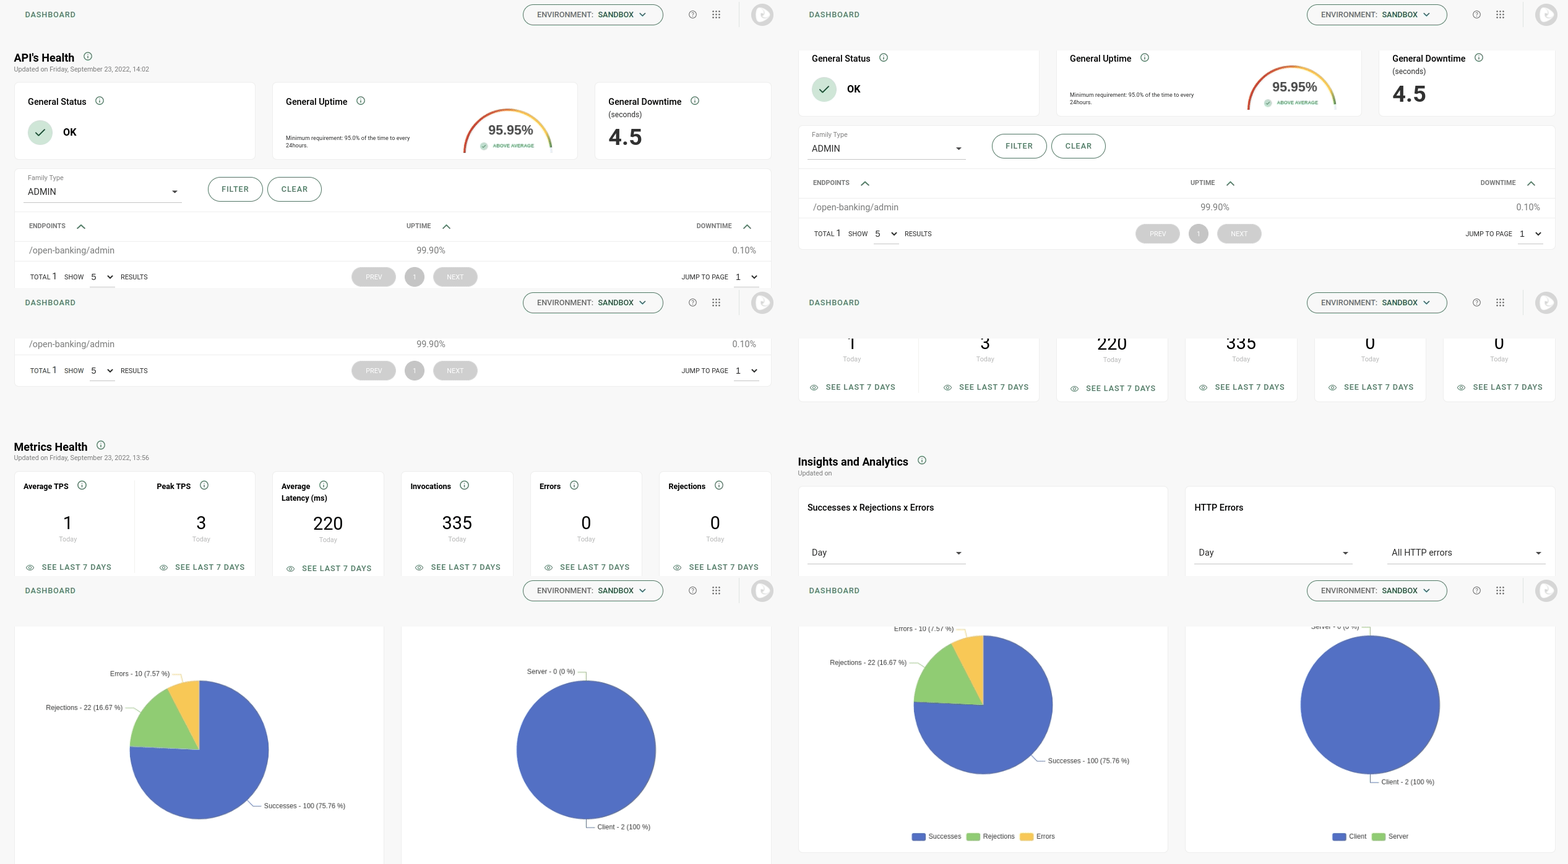
The Dashboard screen allows you to monitor the health of your Open Finance APIs and get valuable metrics and data about how your ecosystem is functioning.
When you access it, you can view information through 3 panels: API’s Health, Metrics Health and Insights and Analytics.

API’s Health
This section monitors the health of the ecosystem globally, with status, uptime and downtime updates every 30 seconds.
The cards contain data from:
-
General Status: with the current status of the ecosystem, which can be:
-
OK: the implementation is fully functional.
-
PARTIAL_FAILURE: one or more endpoints are unavailable. This status indicates that there is an outage or downtime in progress.
-
UNAVAILABLE: the entire deployment is unavailable.
-
When PARTIAL_FAILURE status is pointed out, go to  to check the unavailability. to check the unavailability.
|
-
General Uptime: with the availability rate of all services active on the current day.
-
General Downtime: shows the number of downtime seconds for any API in the ecosystem on the current day.
Metrics Health
This block contains cards with the main metrics for monitoring the APIs' performance, updated 4 times a day.
You can see the information about:
-
Average TPS: average number of transactions per second performed for the Open Finance APIs.
-
Peak TPS: highest TPS call for the APIs.
-
Average Latency: average response in milliseconds of all API calls on the current day.
-
Invocations: number of invocations or API calls made to the endpoints.
-
Errors: total number of calls with error status of the HTTP family type
500. -
Rejections: total number of rejected calls with the status code
HTTP 429 - Too many requests.
To access the last 7 days history of metrics, click on the  button of the desired card. button of the desired card.
|
Insights and Analytics
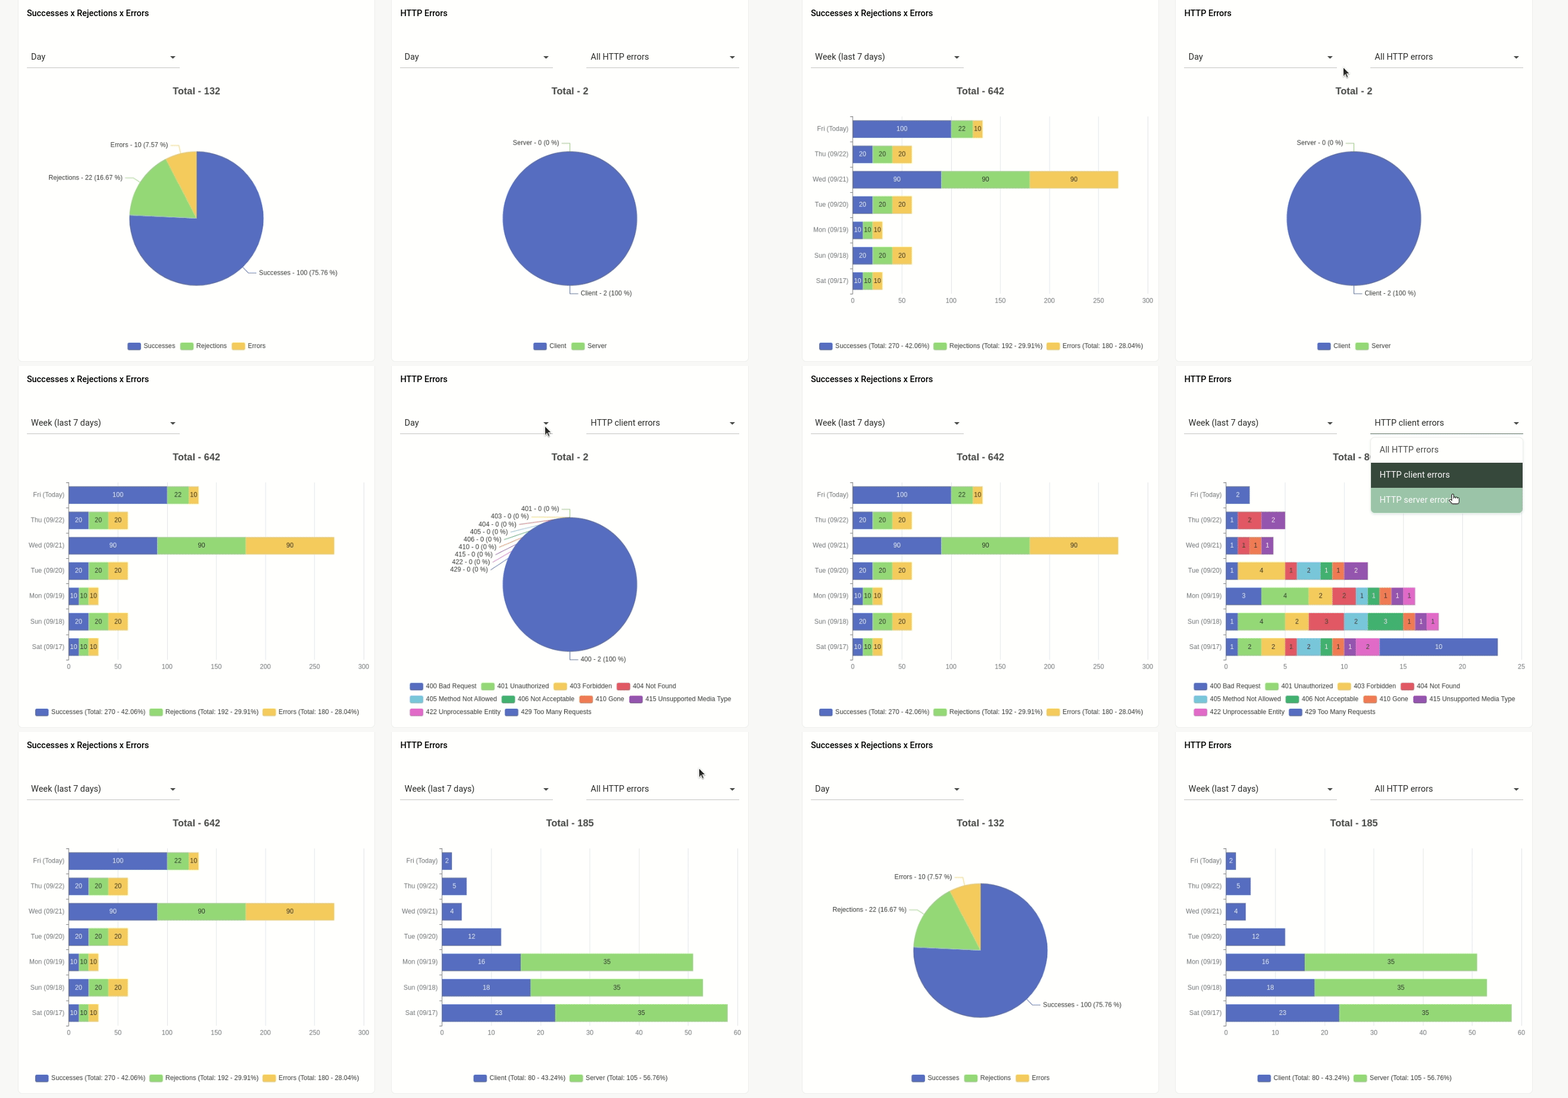
This block displays in graphs the success, rejection or error data collected on the calls of the current day, or of the last 7 days.

Displays the total amount and percentage of calls that got successes:
Success |
Status codes from the |
Errors |
Status codes from the |
Rejects |
Status code |
Displays all errors received on both server and client calls. By default the combined data is displayed. To view detailed information from one or the other, use the filter.
| In item 4 of BCB Normative No. 134 (in Portuguese), BACEN warns about the importance of monitoring this information to detect cyber incidents. |
Share your suggestions with us!
Click here and then [+ Submit idea]