Thanks for your feedback!
EDIT
By clicking the third section of the Analytics menu, the user is redirected to a dashboard by Kibana, our partner:
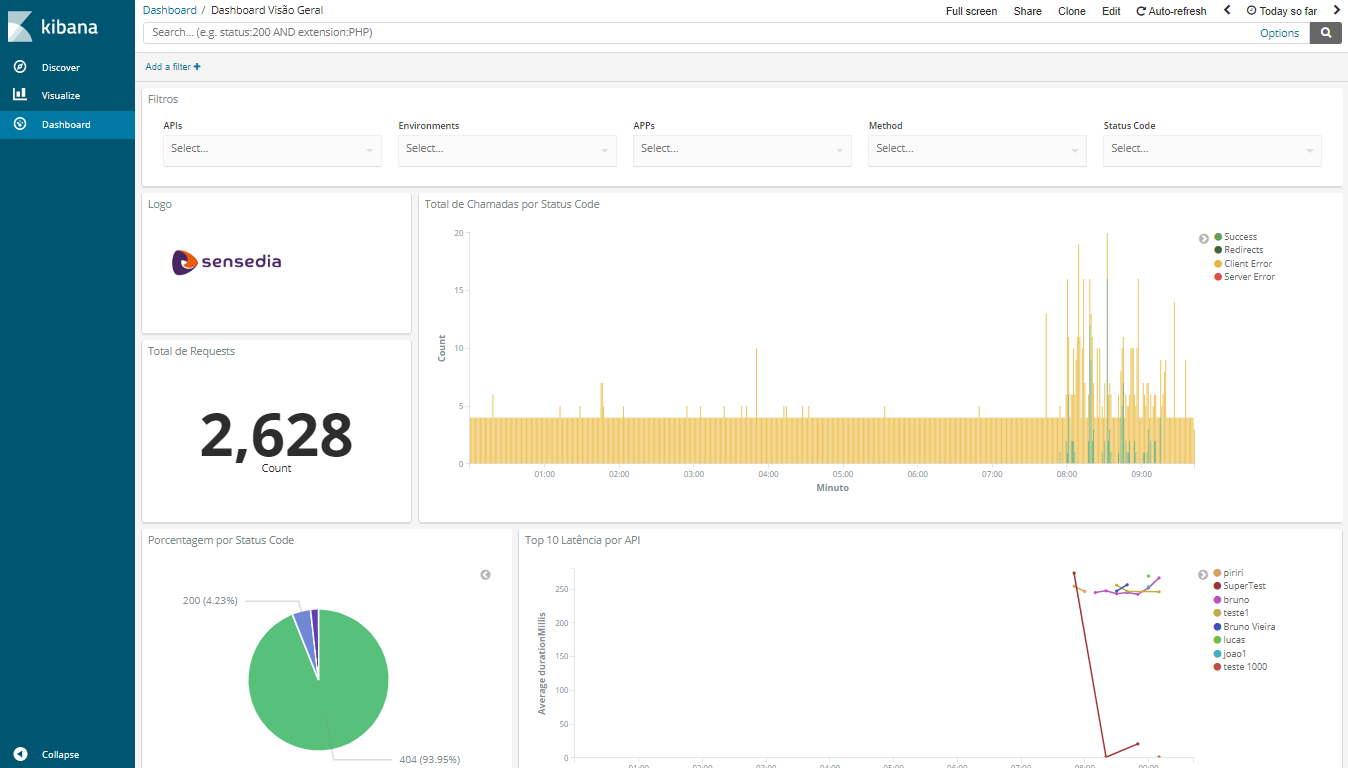
At first sight, the page looks like the general view of our Dashboard (the first section of the Analytics menu). The idea is the same indeed: to monitor your APIs from different standpoints. However, this section is different because it offers more customisation regarding data filters and visualisation. The different types of visualisation are generated from the filters you set up and are highly customisable.
To sum up, Kibana is a powerful tool to visualise Elasticsearch data. This means that it’s perfect for those that have a solid grasp of our Dashboard and want to have even more control of each API variable.
To learn how to set up Kibana according to your needs, check their documentation here. We also provide an Elasticsearch Data Dictionary to help you with Lucene syntax and indexes used to perform searches.
Share your suggestions with us!
Click here and then [+ Submit idea]