Thanks for your feedback!
EDIT
This section shows information about consumption and space used to store calls to your APIs inside Elasticsearch. This is the overview:
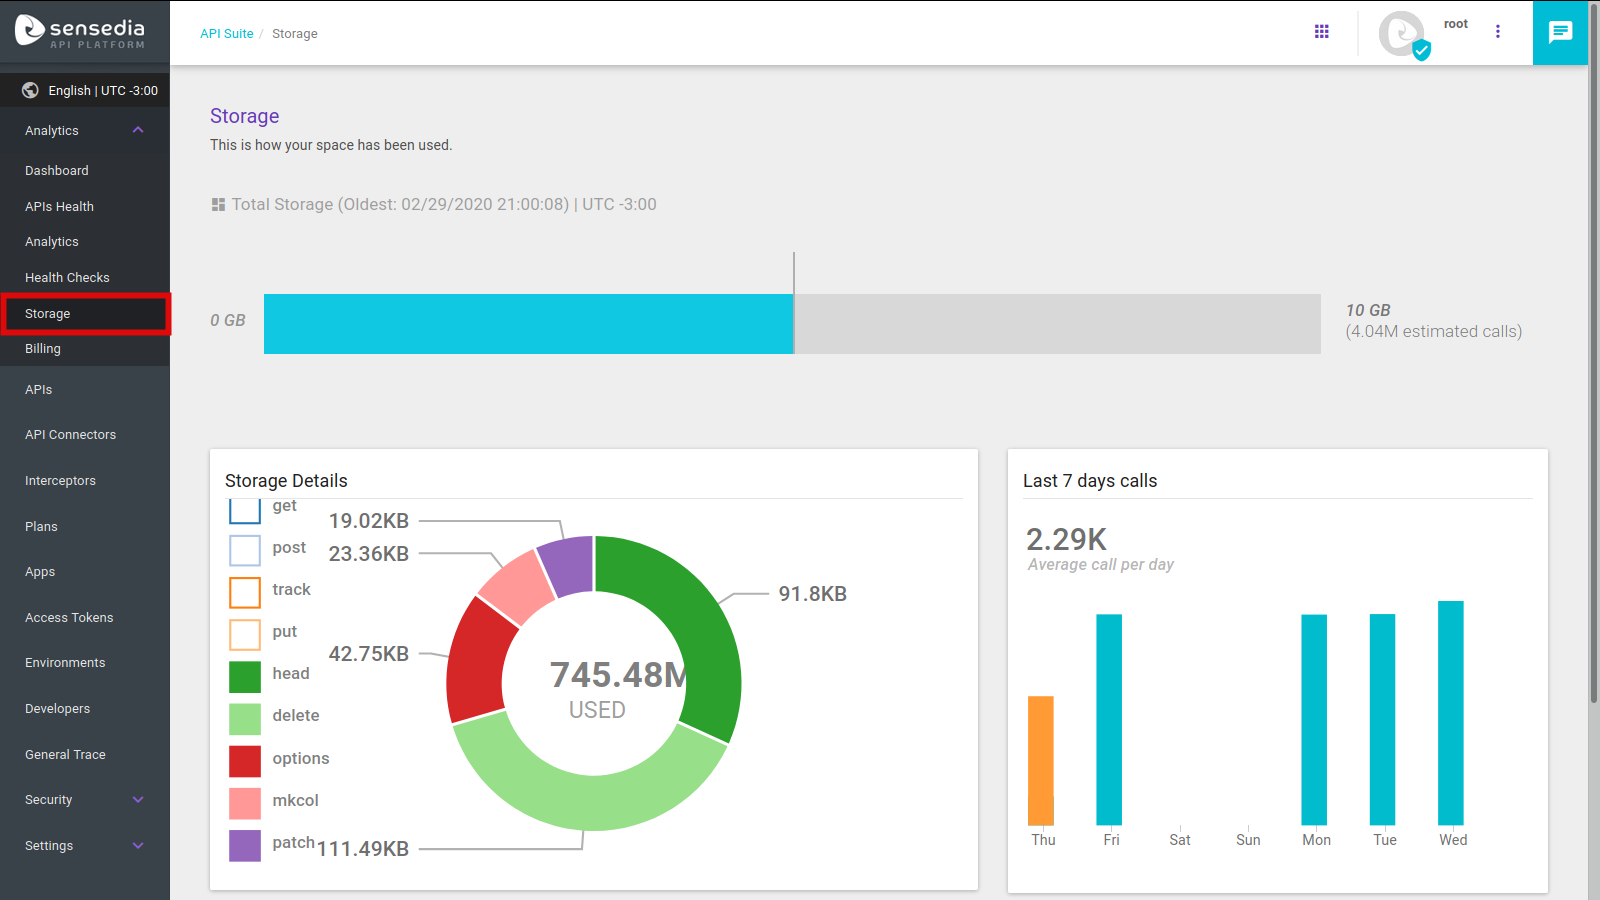
The screen displays several charts representing the information. Let’s cover them all now.
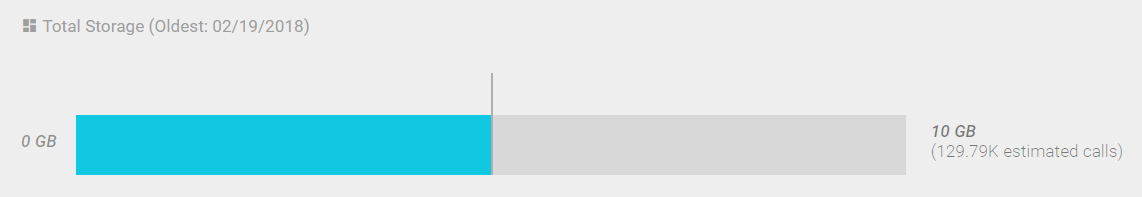
The Total Storage graph shows the space taken up in Elasticsearch along with the numerical representation of the calls made and saved inside the server.
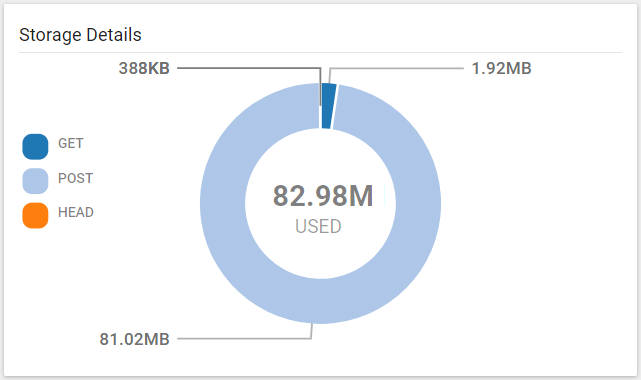
This section displays a pie chart detailing the number of stored calls, categorised and grouped by HTTP method, in addition to the cumulative total of bytes these calls add up to.
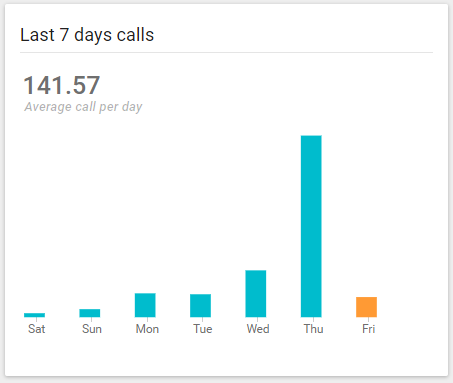
There is a bar graph with well-established data about the calls made on the last seven days along with the average number of requests performed per day.
Finally, at the end of the page, there are three indicators representing information of Total calls, Average call size, and The biggest call size.

Share your suggestions with us!
Click here and then [+ Submit idea]