
Thanks for your feedback!
EDIT
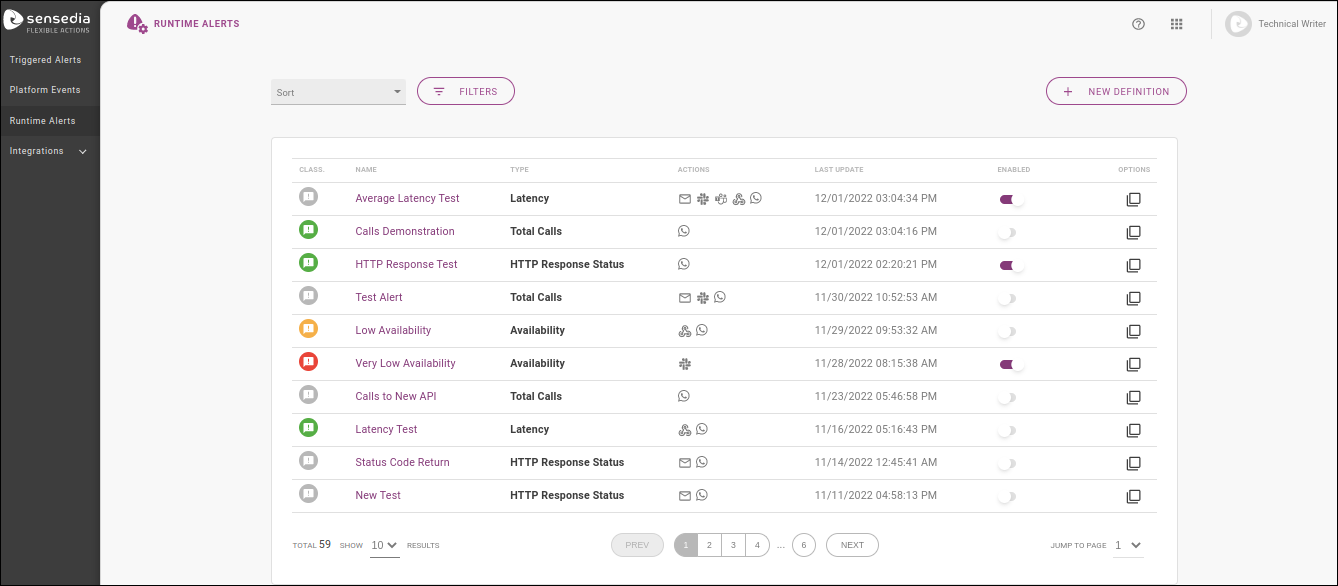
To set up a new API-monitoring alert, click the + NEW DEFINITION button on the upper right corner of the Runtime Alerts page.
The creation process is done with a wizard spanning three stages, which we cover in details below on this page:
EVENT, to define what will be monitored and how often;
ACTIONS, to configure the media used to send the notification; and
REVIEW, which displays the info registered for the alert just created.
The EVENT stage comprises the definition of what will be monitored and how often the state will be checked. It includes these sections: OVERVIEW, EVENT DETAILS, COMPARE WITH PAST PERIOD, SILENT INTERVAL, and SCHEDULE.
|
The default registration of alerts is done by establishing absolute threshold values that, when reached or not reached (depending on the settings), will trigger a notification. But it’s also possible to include alerts that trigger notifications when the threshold values are reached in comparison with a previous period. In this case, they are not absolute values, but indicate a comparison reference between current and past performance. This comparison is configured in the COMPARE WITH PAST PERIOD field. |
The first section is Overview, which comprises three basic pieces of information:
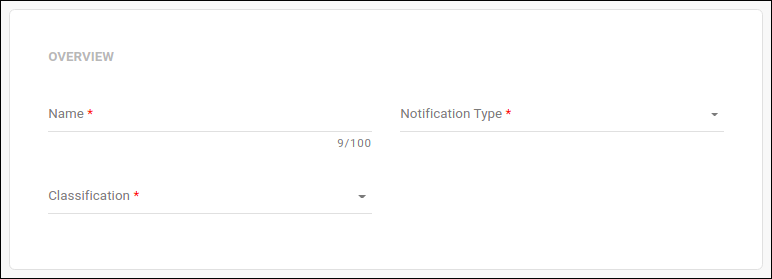
Name: name that helps to identify the alert (it doesn’t have to be unique).
Notification Type: it defines the general parameter to be monitored. Options: total calls, availability, latency, and HTTP Response Status).
Classification: it represents the admonition type: neutral, success, warning or critical.
| The classification does not carry a pre-configured meaning. The user can define the admonition that best suits an action according to their business rules. |
After choosing the type, the other registration sections will be displayed.
The fields of the EVENT DETAILS section comprise the core information of the event to be monitored. You must inform the API resource and operation you want to check and the threshold values that will trigger a notification.
| To keep monitoring as focused as it can be, and then allow you to view focal points accurately, alerts are configured at the operation level. But keep in mind that you can create alerts to all operations (and all resources) you want. |
The fields form the standard message to be sent with a notification and vary according to the notification type:
This alert is triggered when a given number of total calls per period is reached or fails to be reached, depending on what is configured.
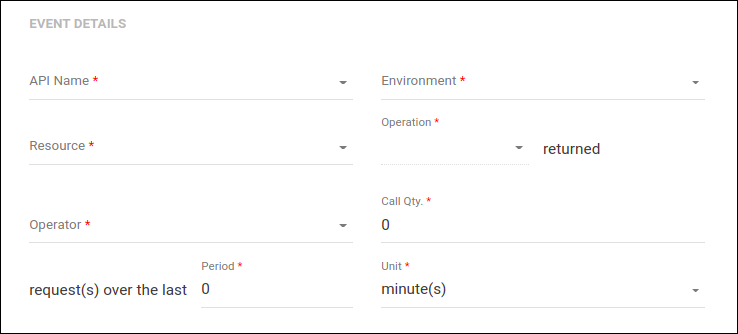
API Name: insert the name of the API you wish to monitor, with AutoComplete function based on the APIs on your Platform.
Environment: environment where the API you selected is deployed.
Resource: API resource to be monitored.
Operation: operation to be monitored for the resource you chose.
returned <Operator> <Call Qty> requests over the last <Period> <Unit>: complete the sentence with the threshold number of total calls and period to be considered for the alert. It comprises:
Operator: qualifies the value inserted with either the option "more than" or "fewer than".
Call Qty: number of calls that (if reached or not reached, depending on the operator chosen) will trigger the alert.
| This field varies if the user enables comparison with a past period when configuring the alert. Then, it will include the choice of total number of calls or percent variation as a reference unit to establish performance comparison. See more in the section Compare with Past Period. |
Period / Unit: fields that comprise the time period to be considered as a reference. Options of units: minute(s) and hour(s).
| The longest interval allowed is 24 hours (or 1440 minutes). |
This alert notifies on the availability of an operation to an API resource (as a percentage).
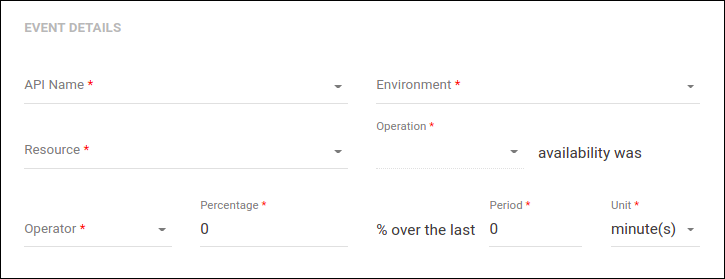
API Name: insert the name of the API you wish to monitor, with AutoComplete function based on the APIs on your Platform.
Environment: environment where the API you selected is deployed.
Resource: API resource to be monitored.
Operation: operation to be monitored for the resource you chose.
availability was <Operator> <Percentage> % over the last <Period> <Unit>: complete the sentence with the percentage of average availability for a given period to be considered for the alert. It comprises:
Operator: qualifies the value inserted with either the option "more than" or "less than".
Percentage: percentage that (if reached or not reached, depending on the operator chosen) will trigger the alert.
Period / Unit: fields that comprise the time period to be considered as a reference. Options of units: minute(s) and hour(s).
| The longest interval allowed is 24 hours (or 1440 minutes). |
Alert for average latency (in milliseconds) in a given period.
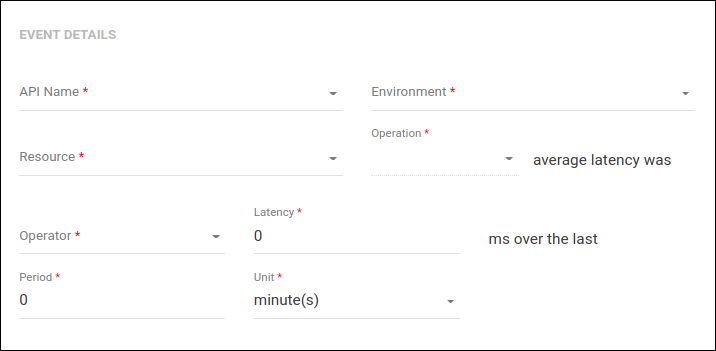
API Name: insert the name of the API you wish to monitor, with AutoComplete function based on the APIs on your Platform.
Environment: environment where the API you selected is deployed.
Resource: API resource to be monitored.
Operation:operation to be monitored for the resource you chose.
average latency was <Operator> <Latency> ms over the last <Period> <Unit>: field to configure the average latency in ms for a given period to be considered for the alert. It comprises:
Operator: qualifies the value inserted with either the option "more than" or "less than".
Latency: average latency value (in ms) that (if reached or not reached, depending on the operator chosen) will trigger the alert.
| This field varies if the user enables comparison with a past period when configuring the alert. Then, it will include the choice of total number of calls or percent variation as a reference unit to establish performance comparison. See more in the section Compare with Past Period. |
Period / Unit: fields that comprise the time period to be considered as a reference. Options of units: minute(s) and hour(s).
| The longest interval allowed is 24 hours (or 1440 minutes). |
This type refers to the quantity of calls returned with a given HTTP status code.
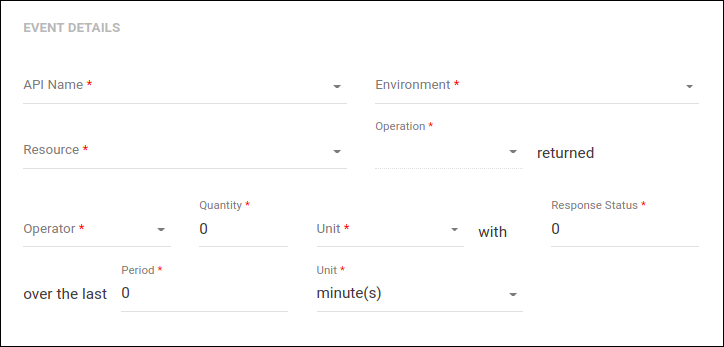
API Name: insert the name of the API you wish to monitor, with AutoComplete function based on the APIs on your Platform.
Environment: environment where the API you selected is deployed.
Resource: API resource to be monitored.
Operation: operation to be monitored for the resource you chose.
returned <Operator> <Quantity> <Unit> with <Response Status> over the last <Period> <Unit>: field to configure the total number or percentage of responses with a given HTTP Status Code for a given period to be considered for the alert. It comprises:
Operator: qualifies the value inserted with either the option "more than" or "less than".
Quantity: number (total calls or percentage, depending on the unit chosen) of responses with a given HTTP code that (if reached or not reached, depending on the operator chosen) will trigger the alert.
Unit: select the unit for the value inserted. Options: percentage or number of calls.
Response Status: define the HTTP Response Status to be considered.
You can include a specific code (e.g.: 504) or a family, using xx (e.g.: 5xx).
Period / Unit: fields that comprise the time period to be considered as a reference. Options of units: minute(s) and hour(s).
| The longest interval allowed is 24 hours (or 1440 minutes). |
The COMPARE WITH PAST PERIOD section allows comparing the threshold values configured with those of a past period in order to trigger notifications. In this case, the values inserted in the EVENT DETAILS section will not trigger a notification when reached as absolute numbers, but only when reached in relation to a past performance.
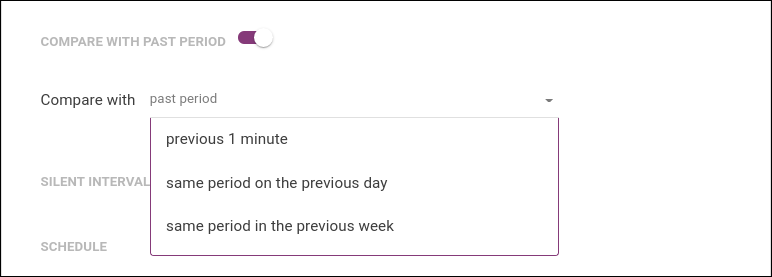
There are three options of period available: last <period> <unit> (if the period is 2 and the unit of the threshold period is minutes, as previously defined, last 2 minutes, if it’s hours, last 2 hours); same period on the previous day; and same period in the previous week.
|
If you enable comparison with past period, you will see a new field in the EVENT DETAILS. section when registering Total Calls and Latency alerts. To configure the threshold values, you can then choose to use percentage as a unit. For Total Calls alerts, instead of the field Call Qty, you will see: For Latency, instead of just Latency, the fields will be: As the other two alert types (Availability and HTTP Response Status) already offer percentages as measuring units, there’s no change in fields when comparing with a past period. |
You can silence a notification for some preconfigured time by enabling the SILENT INTERVAL option. This is useful when, for instance, you know your API will be unavailable for a given time and wish to disable notifications only temporarily, without completely disabling the alert (see here on how to disable alerts).
To configure the silence interval, fill in the field that will open with a number and a time unit (minutes or hours).
| The longest interval allowed is 24 hours (or 1440 minutes). |
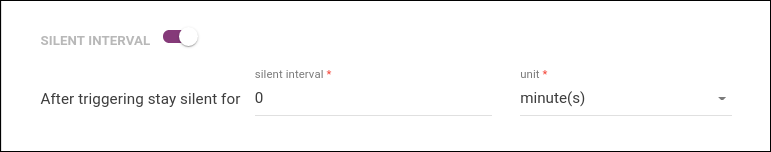
If the option is left always on, the alert will be enabled after the configured interval is due. Then, the next notification that is triggered will be sent as usual and will, in turn, trigger another silence interval.
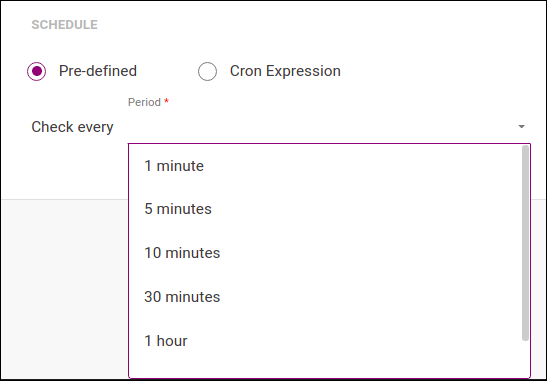
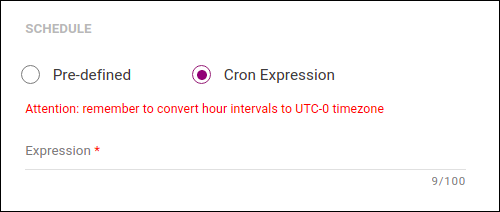
The SCHEDULE section defines the frequency with which the performance will be checked in order to trigger the alerts. These are the two options:
Pre-defined (pré-definida).
If you choose this, fill in the Check every <Period> field with one of these options: every minute, every 5, 10 or 30 minutes; every hour; or every day at 00h.
Cron Expression.
In this case, insert a scheduling option of the Cron type (see the text box below) in the Expression field.
After inserting the data, you can click the NEXT button to go to the ACTIONS stage.
The ACTIONS stage comprises the channels the notification will be sent to:
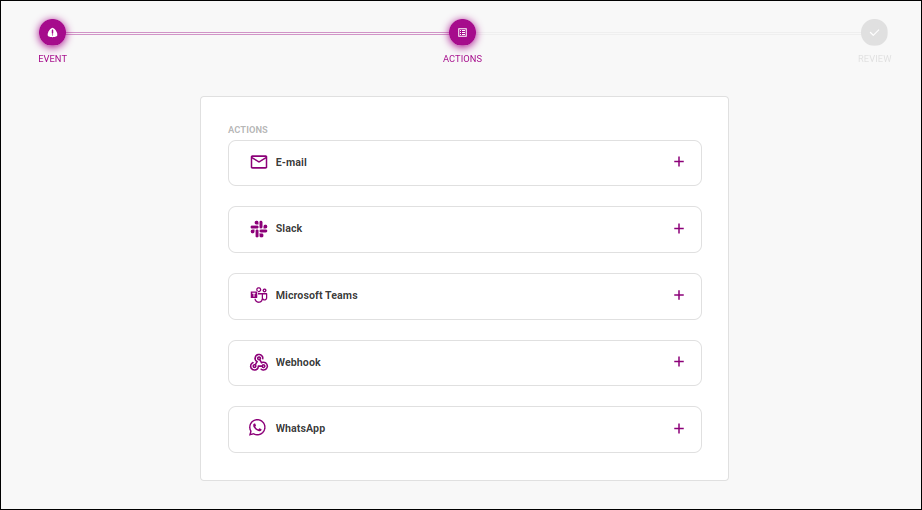
To add an action and configure it, click on ![]() .
.
| You must set up at least one action before you can save/create your alert. |
When this action is configured, a notification email is sent whenever the alert is triggered.
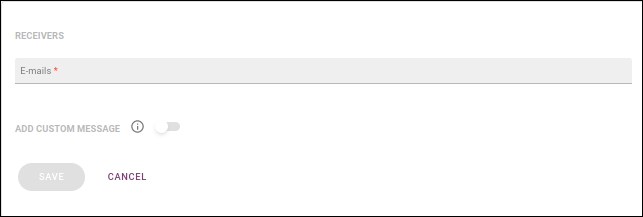
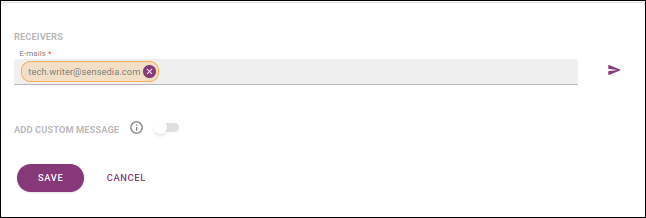
You can include email addresses to send notifications to in the E-mails field, under the RECEIVERS section. You can add as many addresses as you wish, typing each of them at a time or inserting multiple addresses separated by commas.
|
After a receiver is included on the list above, they will receive an email, as the image below shows, asking for consent regarding notifications being sent to them.
The link accessed via the button YES, I WANT TO SEE EVERYTHING will be valid for 24 hours. In case a receiver has not yet given their consent, their email address will be highlighted in yellow on the alert’s editing screen (see more about editing alerts here). You can send a new confirmation email by clicking the icon next to the list of addresses ( |
In the section ADD CUSTOM MESSAGE, you may customise an additional message to be sent with the notification. To do this, enable the button and type your message in the editing field that will open, as in the example below:
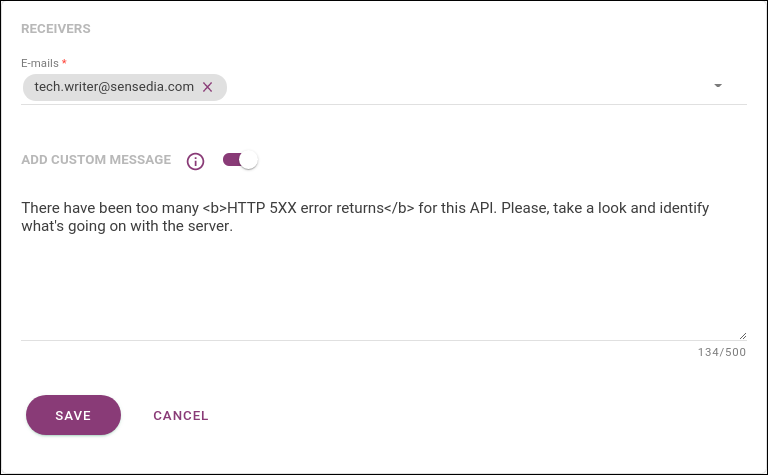
| The message can be written in plain text or HTML. |
When you click SAVE, you’ll see the actions block again, and now the E-mail action will have icons for viewing info (![]() ), editing (
), editing (![]() ) and deleting (
) and deleting (![]() ).
If you click on
).
If you click on ![]() , you’ll see the information you’ve just configured:
, you’ll see the information you’ve just configured:
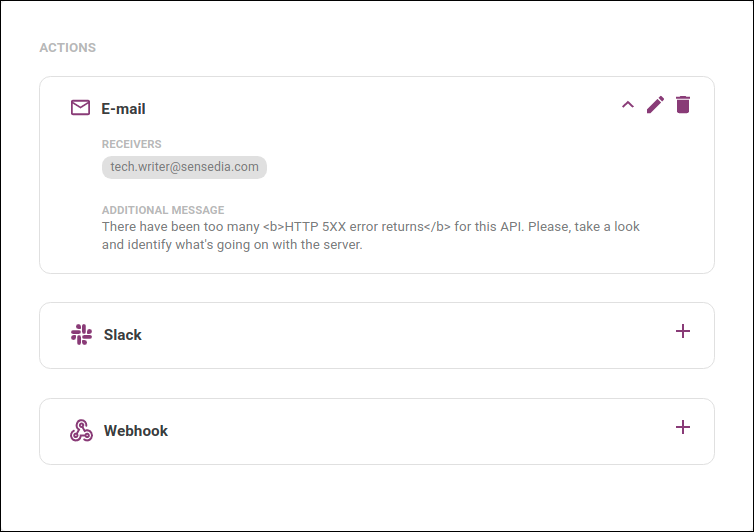
Now, you can configure another action or save the alert, going on to the REVIEW stage.
When this action is configured, a notification is sent to a Slack channel whenever the alert is triggered.
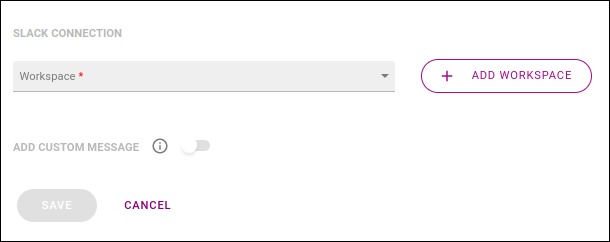
First, select the Slack workspace that will be used. If you haven’t included the workspace on the Integrations screen, you can do it now by clicking the button + ADD WORKSPACE. The process is the same (see more about it here). After you choose the workspace, a field will be displayed for you to pick the channel, as in the example below:
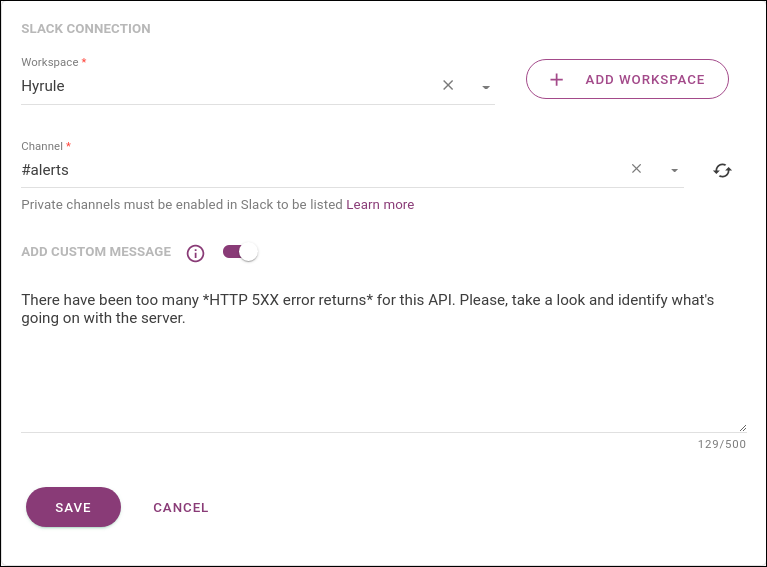
By default, only public channels are loaded, but you can also add a private channel. Read more about these settings here.
| You can select only one channel per alert. |
In the section ADD CUSTOM MESSAGE, you may customise an additional message to be sent with the notification. To do this, enable the button and type your message in the editing field that will open, as in the example image above.
| The message can be written in plain text or using formatting options accepted by Slack. See more about it in the Slack documentation. |
When you click SAVE, you’ll see the actions block again, and now the Slack action will have icons for viewing info (![]() ), editing (
), editing (![]() ) and deleting (
) and deleting (![]() ).
If you click on
).
If you click on ![]() , you’ll see the information you’ve just configured:
, you’ll see the information you’ve just configured:
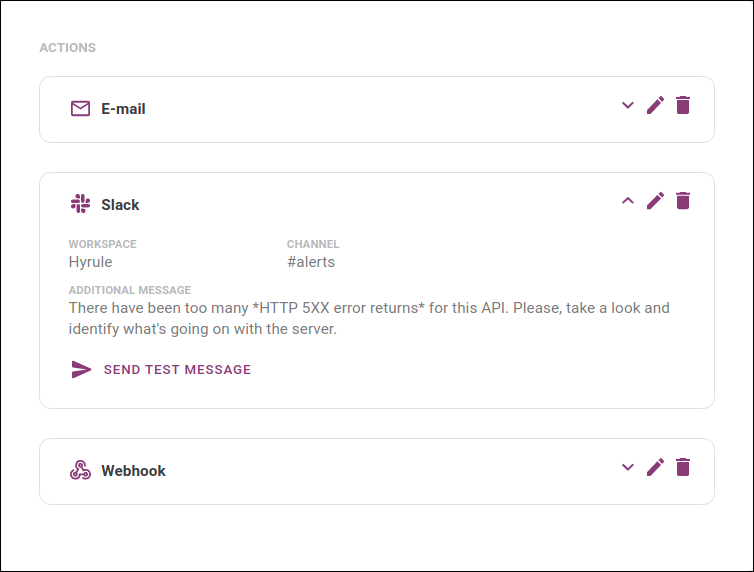
If you wish, you can send a test message to the channel you selected by clicking SEND TEST MESSAGE.
Now, you can configure another action or save the alert, going on to the REVIEW stage.
When you configure a Webhook action, Flexible Actions will send an HTTP POST request to the endpoint you define whenever your alert is triggered. With this, you can trigger a specific API straight from Flexible Actions monitoring. The request payload will include the parameters we’re monitoring for that alert and the additional message, in case you include one.
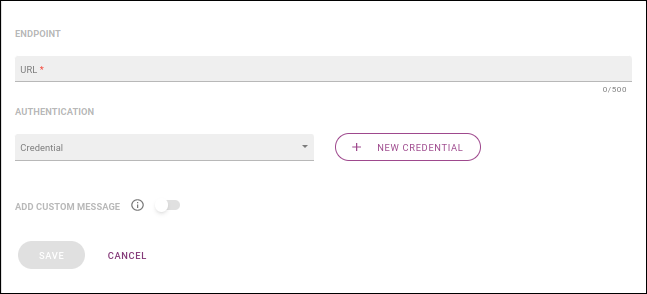
These are the sections you need to configure to set up a webhook:
ENDPOINT: include the endpoint in the Url field.
AUTHENTICATION: non-required section for you to define the credentials Flexible Actions must include in the requests. Each credential is comprised of a client ID accompanied or not by a client secret and it identifies where in the request the information will be included (header or query param). All registered credentials are found on the Integrations screen and you can select the one you want to use in the field Credential. If you haven’t registered the credential you need on the Integrations screen, you can do so by clicking the + NEW CREDENTIAL button. The process is the same (see more about it here).
In the section ADD CUSTOM MESSAGE, you may customise an additional message to be included in the request. To do this, enable the button and type your message in the editing field that will open, as in this example:
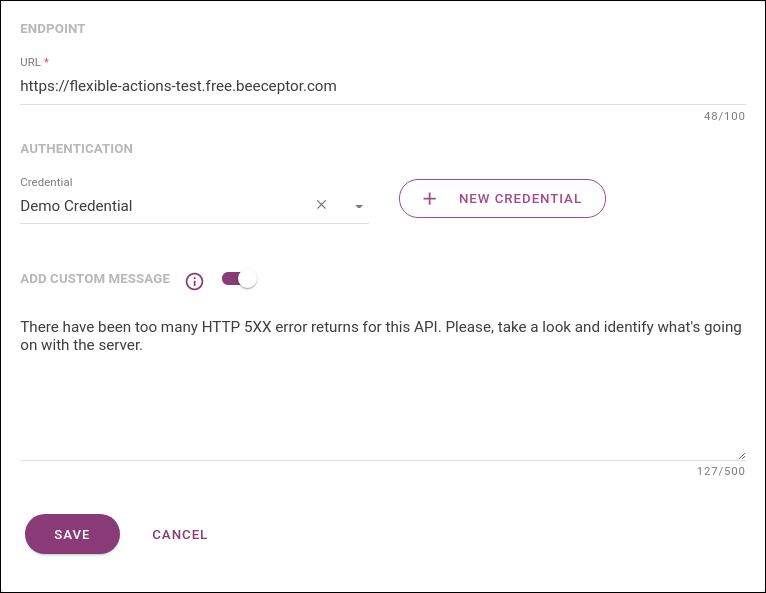
The message will be included in the request payload, identified by "customMessage".
|
When you click SAVE, you’ll see the actions block again, and now the Webhook action will have icons for viewing info (![]() ), editing (
), editing (![]() ) and deleting (
) and deleting (![]() ).
If you click on
).
If you click on ![]() , you’ll see the information you’ve just configured:
, you’ll see the information you’ve just configured:
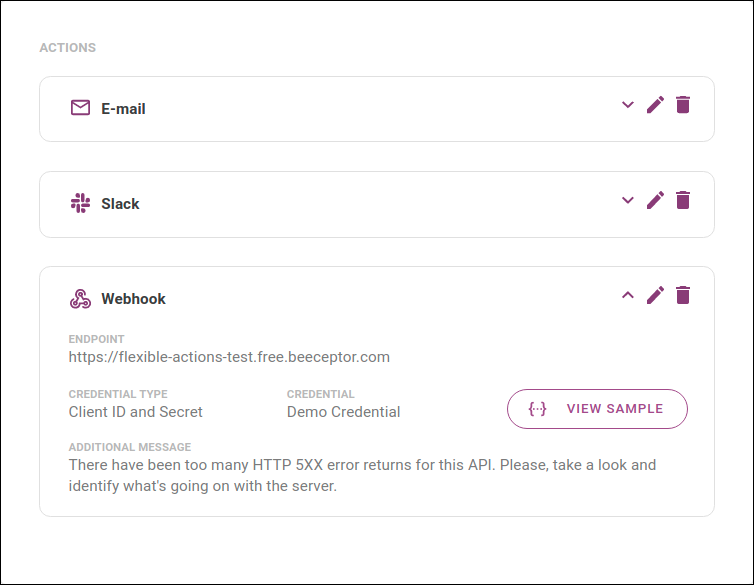
If you wish, you can see the JSON schema and a sample of the JSON payload that will be sent by clicking the {…} VIEW SAMPLE button.
Now, you can configure another action or save the alert, going on to the REVIEW stage.
The REVIEW stage shows a review of the information you entered for the alert you have just created, as in the example below:
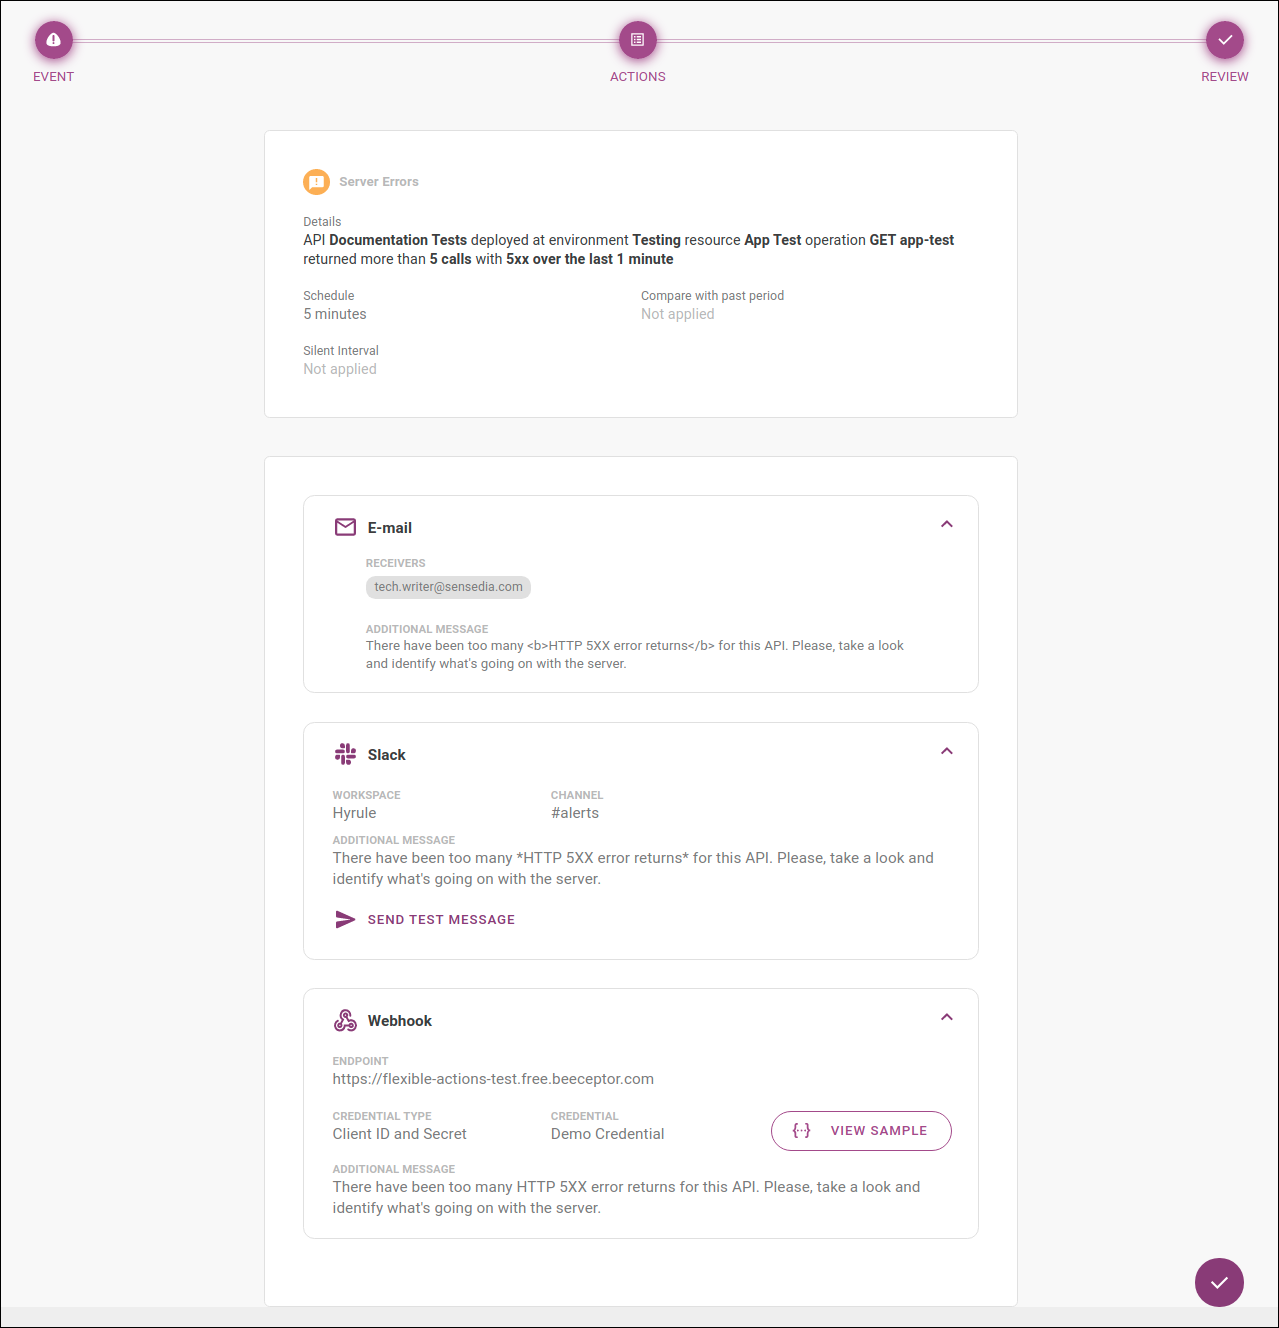
The actions configured will have the icon ![]() for more information.
Also, for Slack you can send a test message by clicking SEND TEST MESSAGE;
and for Webhook you can see the JSON schema and a sample of the JSON payload that will be sent by clicking the {…} VIEW SAMPLE button.
for more information.
Also, for Slack you can send a test message by clicking SEND TEST MESSAGE;
and for Webhook you can see the JSON schema and a sample of the JSON payload that will be sent by clicking the {…} VIEW SAMPLE button.
Share your suggestions with us!
Click here and then [+ Submit idea]