Thanks for your feedback!
EDIT
To view and filter your deployed integration runs, access the Executions screen:
From the product’s left-hand side menu; or
By clicking its card on the Welcome page.
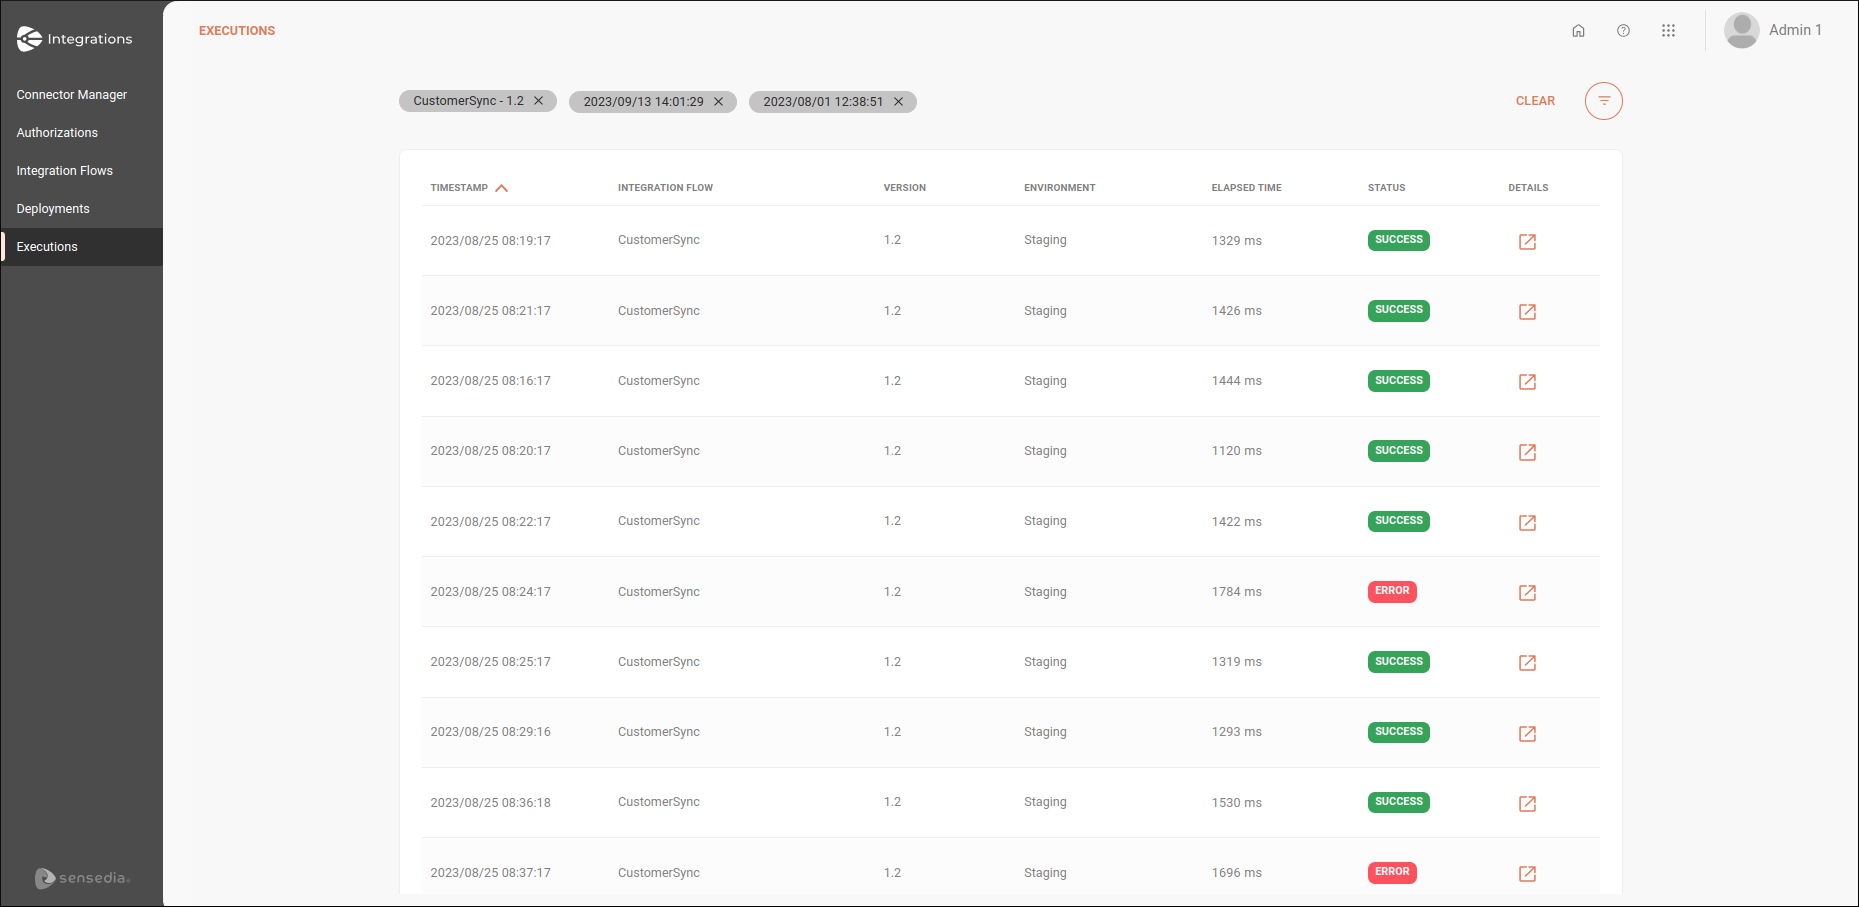
The list of integration runs contains the following fields:
TimeStamp: start date and time of the run. The format is year-month-day for the date and hour-minute-second for the time.
Integration Flow: name of the integration flow.
Version: version of the integration flow.
Release Version: version of the release (automatic). If the flow is not associated with a release, this field will be blank.
Environment: environment where the integration flow was deployed.
Elapsed Time: time, in milliseconds, that the integration flow was run.
Status: run status. Can be success or error.
Details: details of the run.
View Trace:
by clicking the button ![]() , you can view the detailed trace of each step in the integration flows.
This comprehensive view allows you to monitor process performance, identify bottlenecks, and efficiently debug issues.
, you can view the detailed trace of each step in the integration flows.
This comprehensive view allows you to monitor process performance, identify bottlenecks, and efficiently debug issues.
Log Details:
by clicking the  button will take you to Sensedia Analytics, where you will see:
The request logs from the REST Trigger;
The request and response logs from:
Connectors
JSON Transformation
Choice V2
For Each
This way, you will be able to conduct a thorough analysis of integration flows and streamline troubleshooting.
| See log details. |

In Filter for the last, you filter the results of your integration run logs using the buttons:
5 minutes for the last 5 minutes;
15 minutes for the last 15 minutes;
1 hour for the last hour.
When a filter is applied, the results are not automatically updated after a time interval.
It is necessary to use the  button to restore the display of the data corresponding to the filter applied. button to restore the display of the data corresponding to the filter applied.
|
To clear the result of the filter used, click on CLEAR.
The  button allows more advanced filtering of your run records.
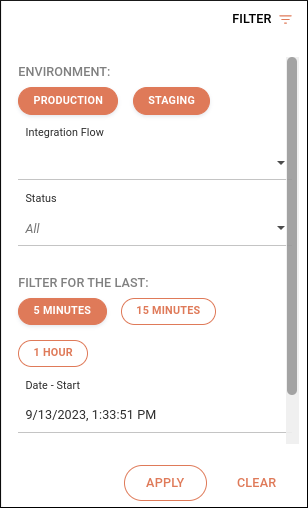
To use it, follow the steps below:
Click on , at the top right of the screen.
In Environment, select the environment. It can be Staging, Production or both.
In Integration Flows, select the integration flow.
In Status, select whether you want to filter by success or error.
In Filter for the last, select the time range you want to check.
You can choose between the last 5 minutes, 15 minutes or the last hour.
In Date-Start and Date-End, select the period you want to filter. The format is year-month-day for the date and hour-minute-second for the time.
Click on APPLY in the bottom right-hand corner.
If you want to clear the data already entered in the filter, click on CLEAR.
| If the filtering returns more than 100,000 records, a message will be displayed requesting refinement of the search criteria. You can select today or up to 7 days ago, including date and time. |
Share your suggestions with us!
Click here and then [+ Submit idea]