Thanks for your feedback!
EDIT
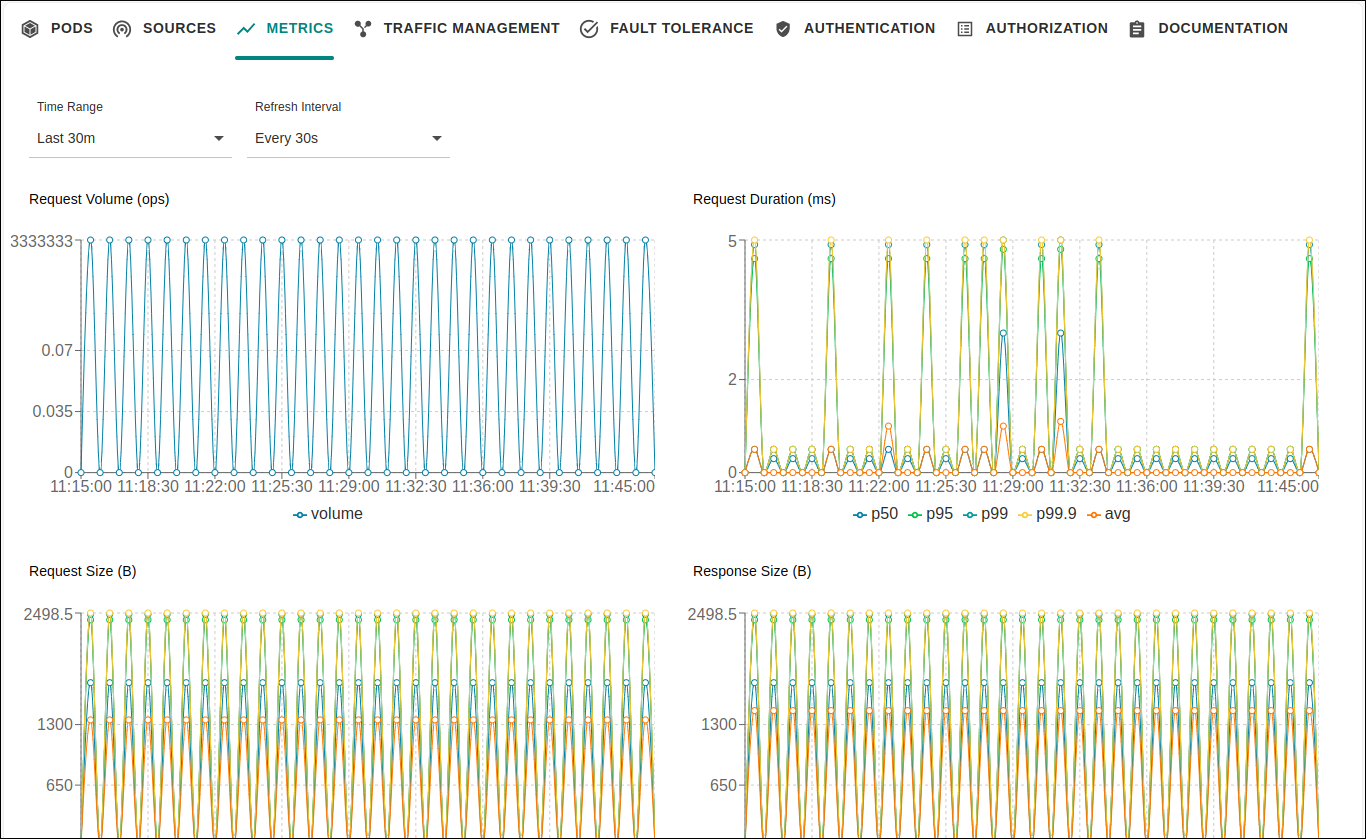
The METRICS tab displays quick real-time metrics that show the behaviour of a service. To access it, select a service on the list of the Services screen (or after clicking a mesh card on the Meshes screen).
| To view service metrics, your user must have the Read Metrics permission enabled in Sensedia Access Control. |
You can filter the information exhibited on the charts based on a time period.
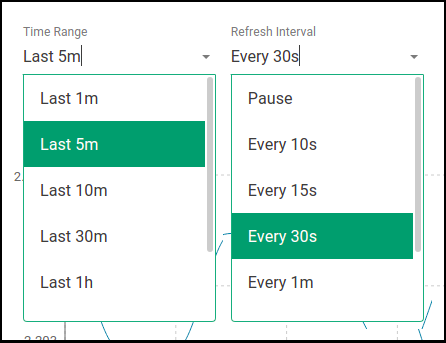
There are two fields to define it:
Time Range: defines the total period that must be considered. Options: last minute, last 5, 10 or 30 minutes, last hour, last 3 or 6 hours.
Refresh Interval: defines the frequency with which the information exhibited is updated. Options: pause, every 10, 15 or 30 seconds, every minute, every 5 or 15 minutes.
For instance, if you choose the last 5 minutes as the time range and a refresh interval of 15 seconds, the metrics will be compiled every 15 seconds and the graphs will display a period of 5 minutes along the x axis.
Request Volume
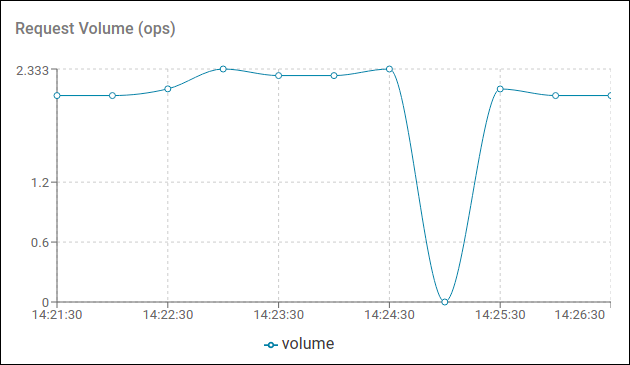
The graph shows the total volume of requests received by the service, in operations per second (ops).
Request Duration
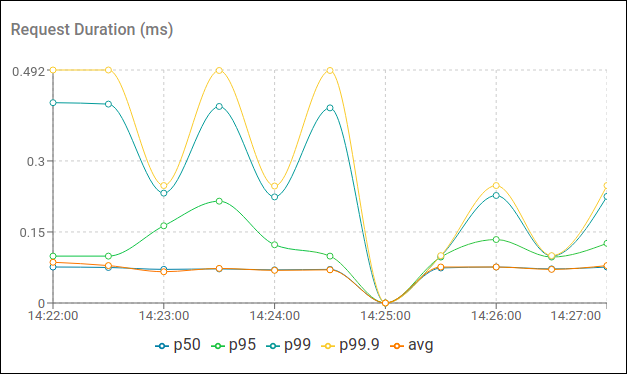
It displays average request durations in milliseconds (ms). The lines represent the mean (avg) and these percentiles: p50 (median), p95, p99 and p99.9.
Request Size
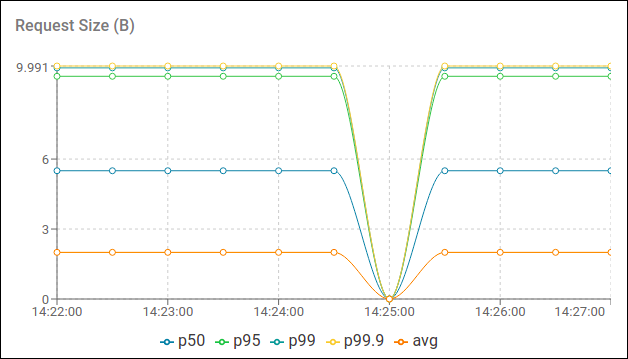
It displays the average request sizes in bytes. The lines represent the mean (avg) and these percentiles: p50 (median), p95, p99 and p99.9.
Response Size
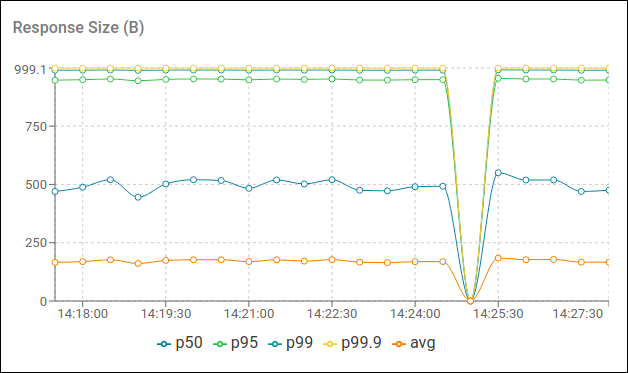
It displays average response sizes in bytes. The lines represent the mean (avg) and these percentiles: p50 (median), p95, p99 and p99.9.
|
You may click the points along the lines to see the exact numbers: 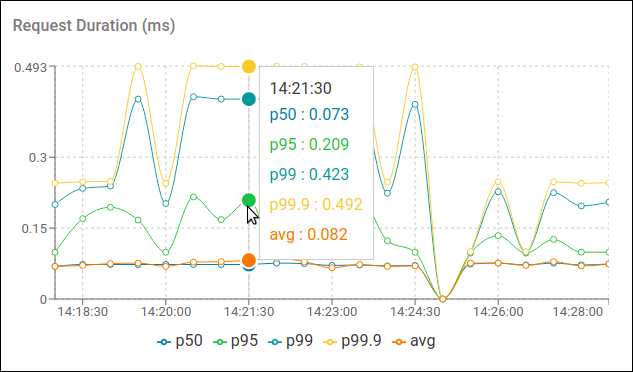
|
Share your suggestions with us!
Click here and then [+ Submit idea]