Thanks for your feedback!
EDIT
The Tracing screen provides tracing data regarding mesh services, at the service- or operation-level.
| You can select the cluster you want to operate in the Cluster: field, located in the upper right corner of the screen. |
|
When an application is comprised of microservices, a request usually goes through many services from the time it enters a mesh to its conclusion. Add to this the fact that you can have multiple deployed versions of a service, either as Canary Release or being tested, and we have a large distributed system with multiple points of failure.
In this case, we need tracing that is also distributed, capable of showing us latency in the communication between different components of a mesh and of identifying the sites where there may be trouble. When we observe the chain of internal requests, we can see how a failure in service A may affect service B and, thus, take action to improve the performance of the whole system.
But how does distributed tracing effectively work?
Our tracing solution was built on top of Jaeger and based on the OpenTracing specification.
When service A needs to call service B, service A’s sidecar inputs context information to the payload as HTTP headers and sends them to service B. In turn, service B forwards these headers — adding its own context information — to service C and so on. Tracing information is stored in a data structure called span. The tracing of a call is comprised of many spans, each representing an internal communication act. Then, when you access a service on the Tracing screen, you can see each span that was generated when a request went through that service. By joining the spans of a call (that is, the several operations between internal services), you can identify all the steps, and the latency between them, from beginning to end of a call.
| Istio proxies can propagate HTTP headers automatically. However, for tracing information to be generated in a unified way, showing all the route of a request from service to service, applications need to receive and forward the headers. See more about Istio’s configuration here. |
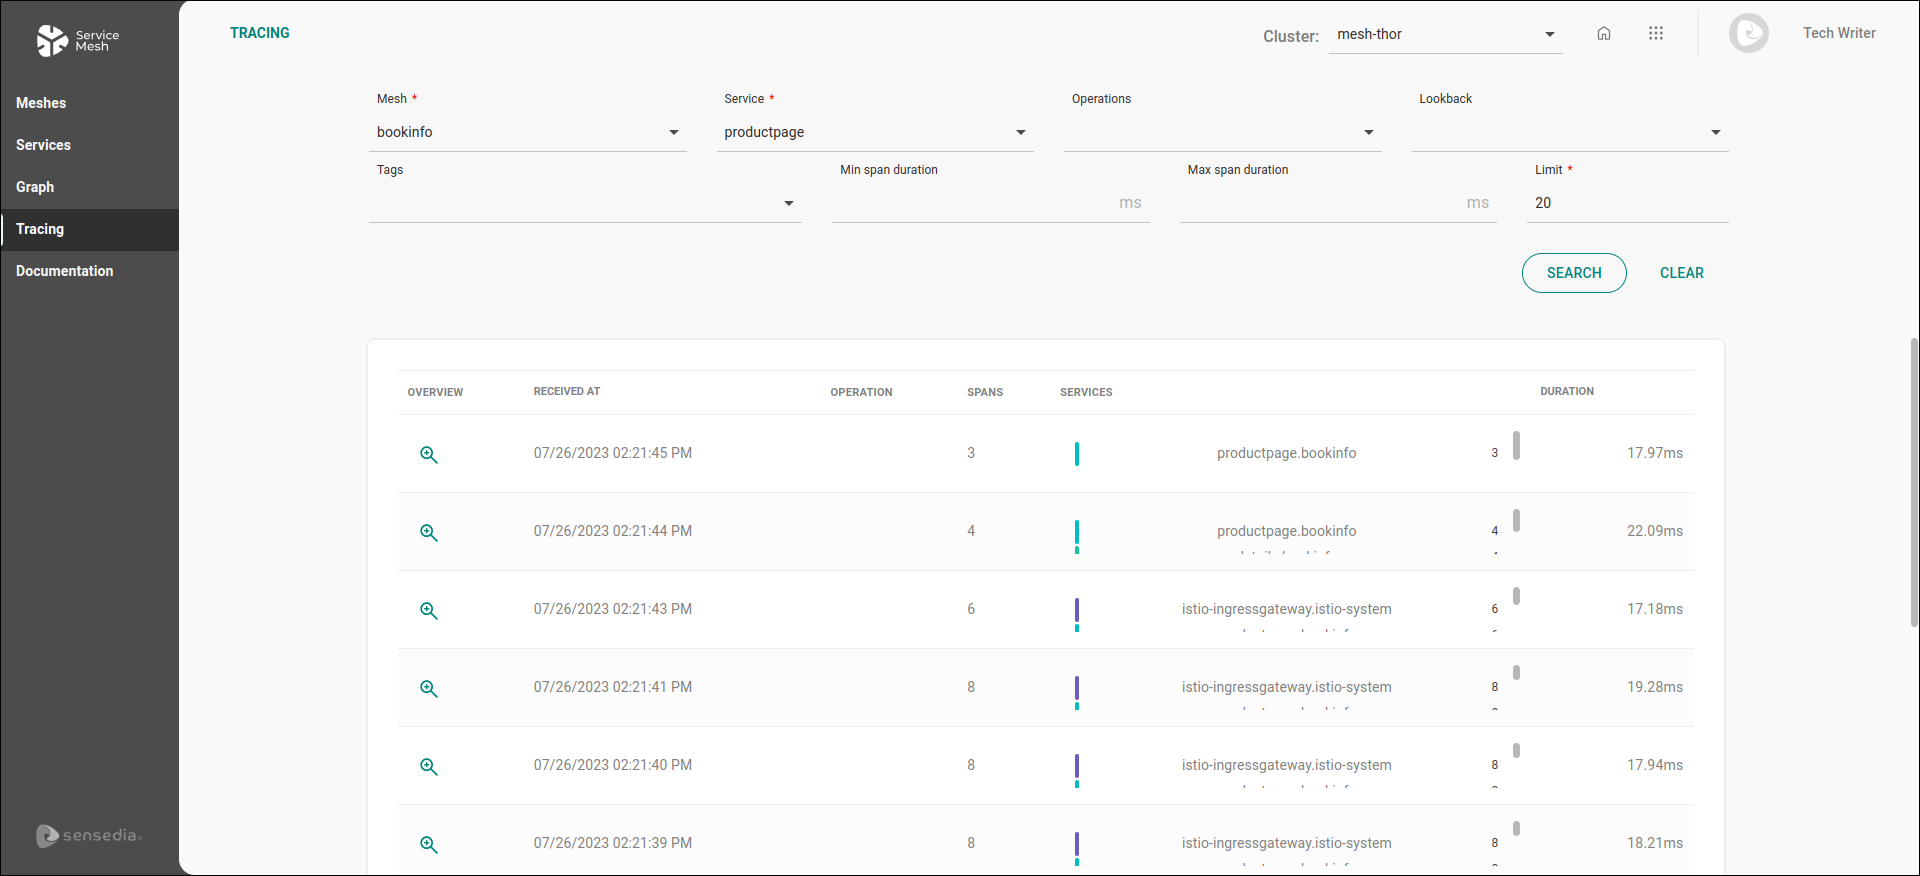
The Tracing screen shows a list of calls from search filters:
If you choose a mesh and a service, you will view the list of tracing items. These items refer to the calls that have gone through the chosen service in the time period considered and will include the many spans generated with the communication between services.
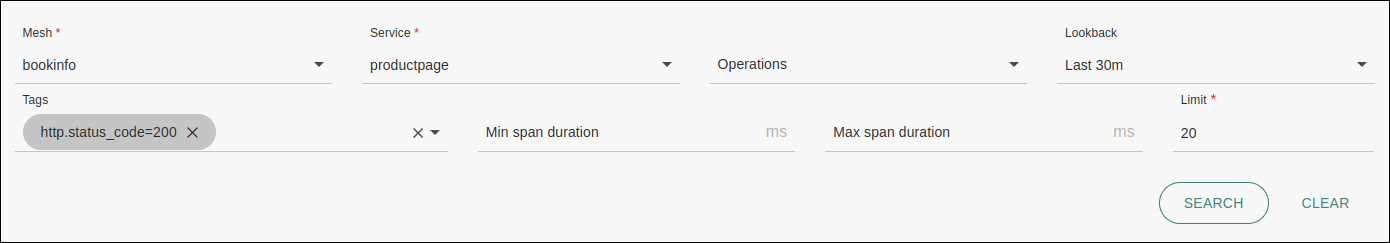
However, you can customize the list returned with basis on other fields:
Mesh: required field.
Service: required field.
Operations: you can select a specific operation. If you leave this field blank, you will view the information referring to all operations of the service chosen.
Lookback: options: last minute, last 5, 10 or 30 minutes, last hour, last 3 or 6 hours. The default time, if no option is chosen, is the last 48 hours.
Tags: allows you to filter items by using tags mapped by Jaeger.
Enter each tag as a key=value pair and press ENTER.
Values containing spaces should be enclosed in quotes.
E.g.: error=true, db.statement="select * from User", http.status_code=200, http.method=GET
Min span duration: filter the items by minimum span duration (in milliseconds).
Max span duration: filter the items by maximum span duration (in milliseconds).
Limit: required field to limit the amount of returned items. By default, the field will contain the value 20, but you can alter it. Note, however, that a high value will lead to higher loading time.
The list of items shows the following information (columns):
RECEIVED AT: the date and time the call was received;
OPERATION: if an operation has been selected in the corresponding filter field, this column will indicate it;
SPANS: the quantity of spans that make up the total call tracing;
SERVICES: the services involved in the call;
DURATION: the total tracing duration (in milliseconds).
|
By default, calls are listed in descending order according to the date and time they were received (i.e. the most recent calls are displayed at the top of the list). You can sort them in ascending/descending order according to the date and time of reception by clicking on the RECEIVED AT column header or in ascending/descending order according to the total tracing duration by clicking on the DURATION column header. 
|
If you click the ![]() icon on the OVERVIEW column, you’ll be redirected to the visualization of the spans for the call.
icon on the OVERVIEW column, you’ll be redirected to the visualization of the spans for the call.
The screen to visualize spans shows two information sections: basic data regarding the tracing and the timeline containing the spans that refer to each other, telling the story of the call.
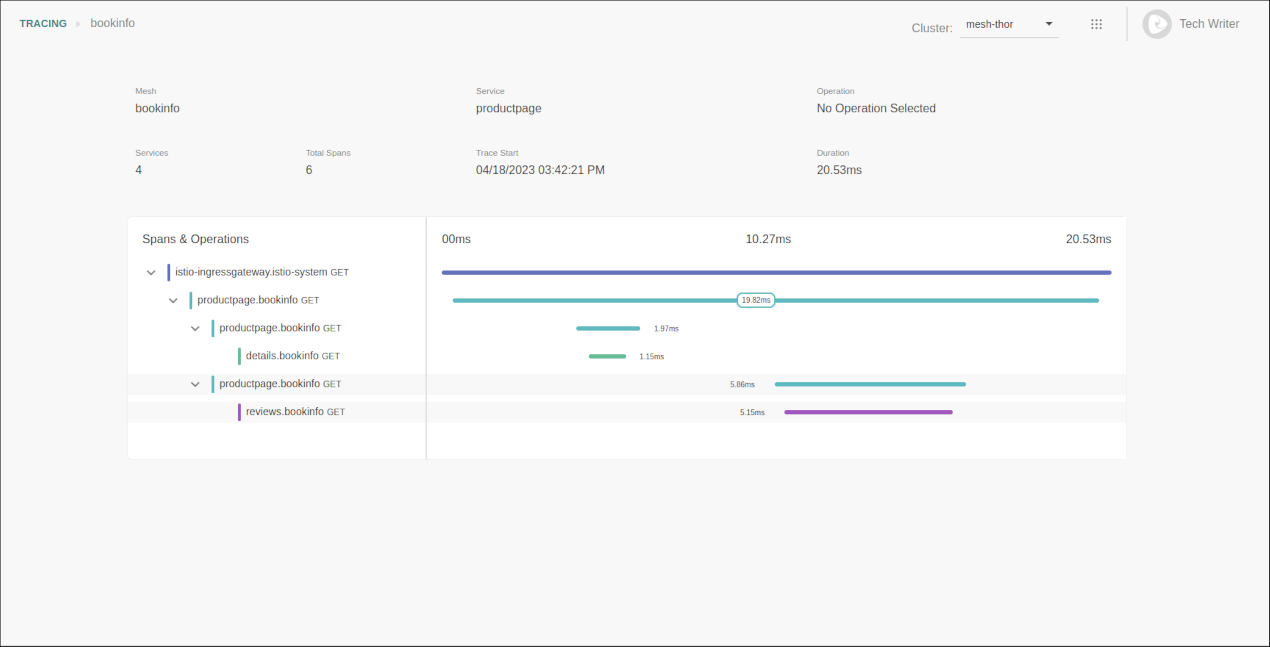
The basic data are:
Mesh: identifies the mesh to which the service belongs.
Service: identifies the service which has been selected to filter the calls.
Operation: displays the operation if it has been chosen in the search fields.
Services: displays the quantity of services involved in the call at hand.
Total Spans: displays the total number of spans that make up the call tracing as a whole.
Trace Start: date and time of the tracing start.
Duration: the total duration of the tracing.
The timeline displays the total tracing time and may be expanded to display each span, with its duration time and details.
Share your suggestions with us!
Click here and then [+ Submit idea]