Thanks for your feedback!
EDIT
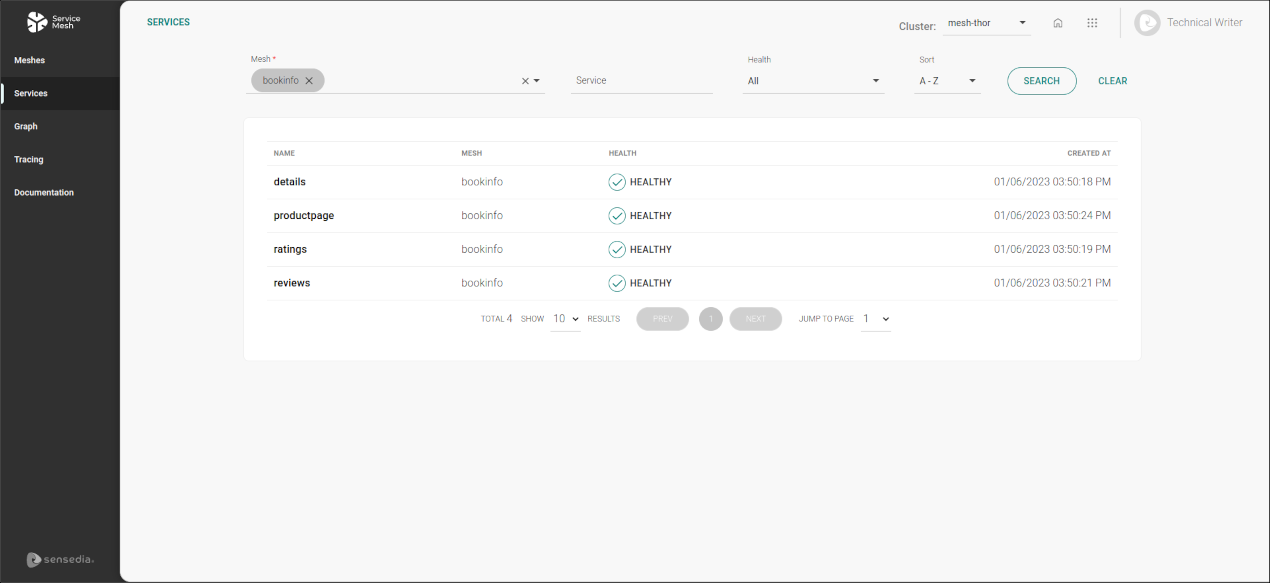
The Services screen is found on the main menu. It displays a range of information regarding each service of a mesh and allows applying rules and policies intuitively through configuration tabs.
| You can select the cluster you want to operate in the Cluster: field, located in the upper right corner of the screen. |
The actions you can perform on this screen depend on the permissions set for your user in Sensedia Access Control.
The following table shows the possible permissions and the corresponding actions:
| Permission | Description |
|---|---|
List Services |
It allows the user to view the list of the services that comprise the meshes. |
Read Services |
It allows the user to access the screen for viewing the configuration tabs of a service by clicking on its name in the list. |
To visualize the services, you must first select one or more meshes in the Mesh field.
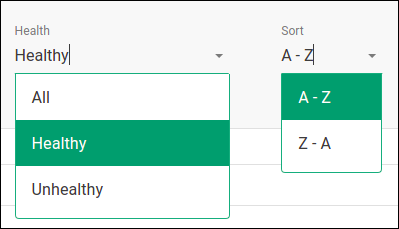
All services comprising the meshes will be listed alphabetically — in ascending order by default, but the descending order can be chosen in the Sort field. The Health field allows filtering either healthy or unhealthy services.
You can also filter the list by the name of a service (or part of it) by typing it in the Service field.
To apply the filters, click the SEARCH button. To clear the search fields, click CLEAR.
The table of results displays, for each service:
its name (NAME column);
the mesh it belongs to (MESH column);
its health status (healthy or unhealthy, HEALTH column);
date and time it was created (CREATED AT column).
If you click the name of any service on the list, you’ll see the tabs screen for that service.
| You can also access the tabs for a service by clicking a mesh card on the Meshes screen and then clicking the name of a service. |
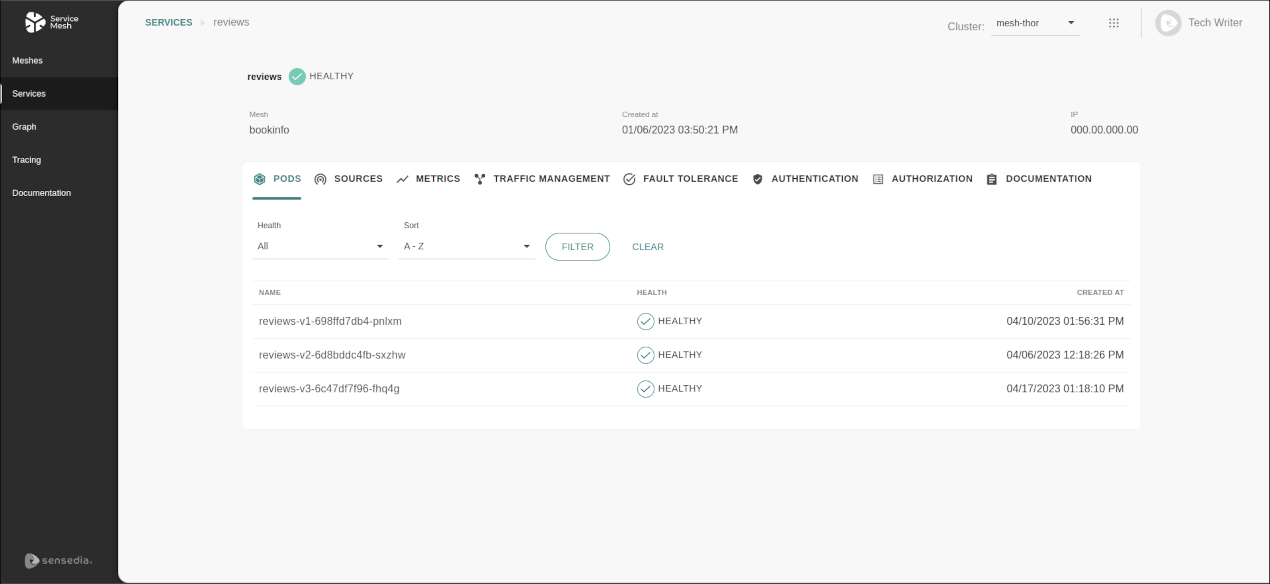
The configuration tabs offer management and observability features (which we cover in detail in the pages on each tab):
PODS: shows the pods that make up the service.
SOURCES: shows the origin of incoming requests.
METRICS: shows quick metrics about incoming requests.
TRAFFIC MANAGEMENT: applies traffic policies.
FAULT TOLERANCE: offers four features to define fault tolerance rules for a specific service: Circuit Breaker, Request Timeout, Fault Injection, and Retry.
AUTHENTICATION: configures authentication for the service.
AUTHORIZATION: applies authorisation rules to the service.
DOCUMENTATION: allows uploading the documentation (Swagger) of the API which exposes the corresponding microservice.
Share your suggestions with us!
Click here and then [+ Submit idea]